Introduction
Tutorials
Improving a discharge simulation
Use the multiple graph time calcs window when you are displaying time-dependent series (for example discharges, pressure falloffs and some chemistry results). Time calcs lets you move series along the time axis:
to set the time origin for one series, for example to look at pressure response see below.
or to move series made at different dates or at different sites so that they align, so you can compare them easily see below.
Contents:
Note
Navigate to Reservoir > Transient > Injection. Tag well AT-102 and click Multiple Graph.
In multiple graph, click Time Calcs and set:
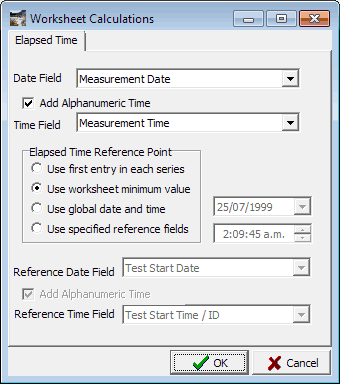
Note: If this was a chemistry time measurement then Date field and Time field would be Sample date and Sample time / ID.
Click OK.
Click Settings and set:
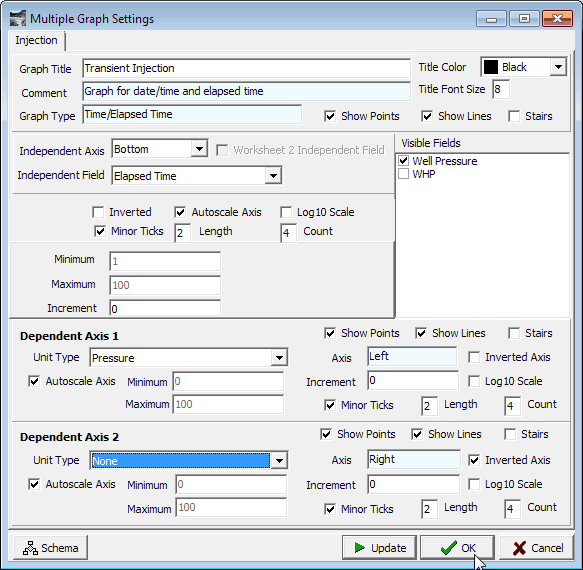
The axes are Elapsed time and Pressure. Click OK.
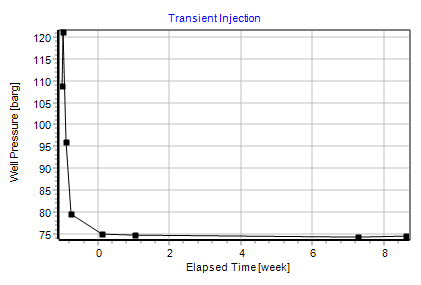
The graph is this, as you might expect:

What's happening here? In Time calcs:
Date field and Time field are measurement date and measurement time.Add alphanumeric time is ticked.Elapsed time reference point (the time axis zero) is set to Use worksheet minimum value.This all causes WellSim to calculate elapsed time by adding measurement date and measurement time and subtracting the smallest measured date/time (the worksheet minimum, 25/7/1999 2:9:45, the start of the test).
You can see the measured dates and times in the multiple graph worksheet (on the left). WellSim calculates the elapsed time for each worksheet row; these are visible at the right of the worksheet (you'll probably need to scroll sideways to see them).
And because the elapsed time axis is set to autoscale, the graph fits the axes. Note: The graph looks the same as if you had chosen Measurement date as the independent axis.
Now let's change the time axis zero point. In time calcs, set:
| Field | to |
|---|---|
Elapsed time reference point |
Use global date and time |
| Date | 1/8/1999 7 days after the test started |
| Time | 0:0:0 (is 12 am) |
WellSim now calculates elapsed time relative to 1/8/1999. The time axis zero is now 7 days after the start of the test:
For a practical use of this see below.
Exit multiple graph.
Date field and Time field: You can enter the time in a date field:
If you have entered the measurement times in Measurement date: WellSim always adds the time to the date to calculate elapsed time. Ticking Add alphanumeric time has no effect.
If you have entered the measurement times in Measurement time / ID: tick Add alphanumeric time to have these times included in elapsed time. However, if the measurement dates cover many weeks then doing this won't make much difference.
Navigate to Reservoir > Transient > Injection. Tag wells AT-102 and AT-105. Click Multiple Graph.
In multiple graph, click Time Calcs and set:
Click OK.
Click Settings and set:
The axes are Elapsed time and Pressure. Click OK.
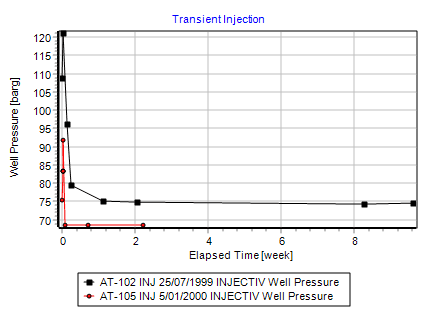
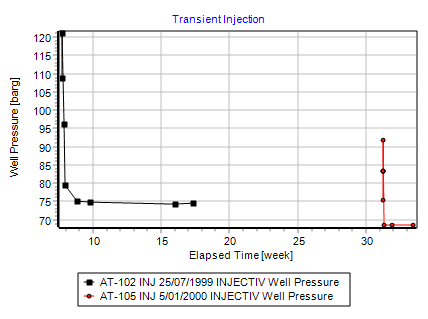
Use worksheet minimum value: The graph now shows:

Because Elapsed time reference point is set to Use worksheet minimum value, then both series use the smallest measurement date/time (the start of the AT-101 test) as the zero for calculating elapsed time.
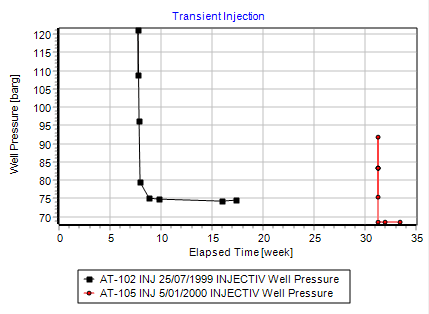
Use first entry in each series: Let's slide the two series over each other. In time calcs, select Use first entry in each series. This causes WellSim to to calculate the elapsed time for each series using a different time axis zero for each series. (It uses the first (earliest) date and time for each series). This suprimposes the two series:
Use global date and time: In time calcs, select Use global date and time. The effect is similar to Use worksheet minimum value, except that you can specify the time axis zero point. The default global date and time is the worksheet mimimum value (25/7/1999 2:9:45), so the graph is the same as the Use worksheet minimum value graph above:
Now change the global date and time in time calcs. Enter a global date of 1/7/1999 and time 0:0:0 (12 am). The series shift on the time axis so the zero is 1/7/1999:
Use specified reference fields: In time calcs, select Use specified reference fields. Reference date field is Test start date, leave Add alphanumeric time unticked because here there are no test start times here. The effect is similar to Use first entry in each series, except that you can specify the time axis zero point to be the test start dates/times for each series:

The graph here looks much the same as the graph for Use first entry in each series, because each test start date is the same as the test's earliest measurement date.
The pressure response to flow changes gives information about reservoir characteristics, most notably permeability but also porosity. This tutorial covers the pressure response to flow starting, which is often approximately linear with log time.
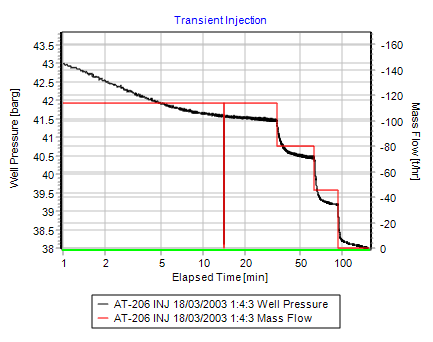
Navigate to Reservoir > Transient > Injection. Tag well AT-206 18/03/2003 1:4:3. Click Multiple Graph.
In time calcs, tick Add alphanumeric time and select Use worksheet minimum value.
In settings, set independent axis to elapsed time, log scale, and set the independent axes to well pressure and mass flow. Invert mass flow because injections have negative mass flow. The graph is:
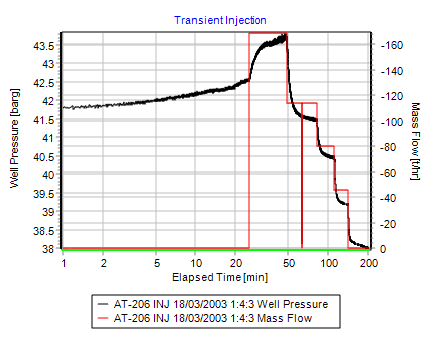
Note that the pressure response to flow starting, at about 25 min elapsed time, is not linear as we hoped. To achieve this, it is necessary to change the elapsed time zero to when the flow started, at 1:04:03. In time calcs, select Use global date and time, use the default date 18/3/2003 and set the global time to 1:04:03. The pressure response now looks more linear:
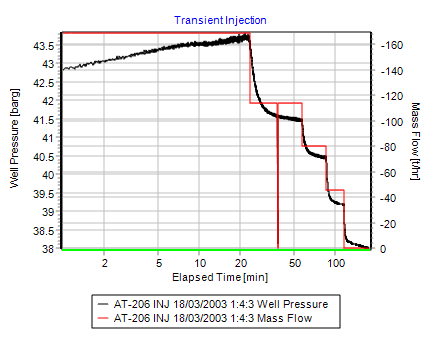
Let's look at the response to flow dropping from about 169 to 114 t/hr at 1:27:43. In time calcs, change the global time to 1:27:43:
For transient tests: when you enter the data it is usually best to set test start date and time to the date and time when the transient event started, rather than when the measurements started.
In the example above we had to select Use global date and time and set the global time to 1:4:3 to change the elapsed time zero to when the flow started. If we had entered a test start date of 18/3/2003 1:4:3, then we could have selected Use specified reference fields (which is Test start date) and immediately seen the desired graph.
The pressure response to flow changes gives information about reservoir characteristics, most notably permeability but also porosity. This tutorial covers the pressure response to flow stopping, which is often approximately linear with log Horner time.
In multiple graph, WellSim automatically calculates Horner time and log Horner time for transient pressure buildup and falloff tests (if test event duration has a value). These are displayed beside elapsed time at the right end of the multiple graph worksheet.
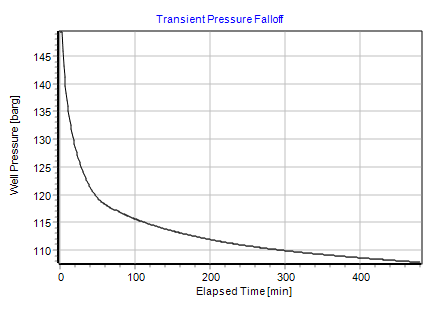
Navigate to Reservoir > Transient > Pressure falloff. Tag well AT-102. Click Multiple Graph.
In time calcs, tick Add alphanumeric time and select Use worksheet minimum value.
In settings, select Elapsed time:
In settings, select Log Horner time:
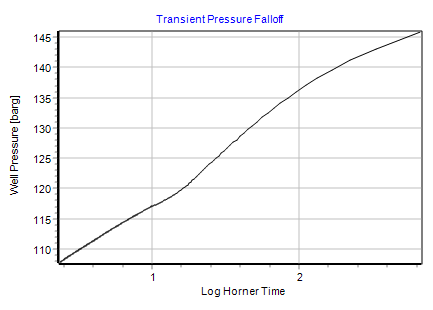
The series is approximately linear.