Introduction
Tutorials
Improving a discharge simulation
WellSim models a steady state discharging wellbore. Steady state means that the flow of the geothermal fluid is stable, and does not change with time. The discharge could be to atmosphere, or through piping to a power station.
The fluid discharging up the well can be liquid, dry steam or two-phase (both liquid and vapour). A well can have the same type of fluid throughout, but often a well has liquid flow lower down, which flashes to two-phase above a certain depth as the pressure decreases up the well.
The well fluid is not simply pure water, but usually contains a range of solids and gases:
The dissolved non-condensible gases are predominantly CO2. WellSim represents the gases by an equivalent CO2 content. The gases can be in both the liquid and vapour phases.
The dissolved solids are predominantly NaCl. WellSim represents the dissolved solids by an equivalent NaCl content. The solids can only be in the liquid phase.
Enter CO2 and NaCl concentrations in total fluid.
In two-phase flow, the liquid and vapour parts can travel together in different ways, called the flow regime. The flow regime depends on the relative speed of the two parts and the relative amount of each. The latter is called the dryness: the ratio of mass of vapour to total mass of fluid.
As the two-phase fluid travels up the wellbore, the amount of vapour usually increases, and therefore the dryness increases. Typical flow regimes up the wellbore, in order of increasing dryness, are bubble, slug, churn or froth, annular or annular-mist, mist. Just above the flash point, the flow regime:
Starts as bubble flow, as small bubbles of vapour appear in the fluid.
Changes to slug flow when the small bubbles coalesce to larger volumes of vapour, which break up the liquid into chunks, called slugs.
Changes to churn flow when there is not enough liquid to maintain the liquid slugs.
These are usually the same throughout the well if there are no secondary feedzones, so you can enter values measured at the wellhead for downwell values. Enter CO2 and NaCl concentrations in total fluid.
In this help guide, MY WELL's deepest feedzone's relationship is Linear, and the feedzone factor is 0.118 bar/t/hr.
If the reservoir is single-phase water, as most are, use a static temperature survey to find reservoir temperature and use steam tables to calculate reservoir enthalpy. This is equal to the enthalpy in the well at the deepest feedzone provided it doesn't flash in the feedzone. For most discharging wells the energy loss up the well from friction and heat loss to the surrounding rock is small, therefore the enthalpy only decreases slightly up the well.
In this help guide, MY WELL's enthalpy at the deepest feedzone is 1,524.52 kJ/kg and at the wellhead is 1,500 kJ/kg.
Look at the Flow Regime at the deepest feedzone; if it is Liquid (below the flash point) then choose Liquid; otherwise choose Two-phase.
From a static temperature survey.
This is the undisturbed reservoir pressure, at a distance from any well. Find from:
In this help guide, MY WELL's reservoir pressure is 200 barg.
Depth type can be:
Note:
Start depth: (the depth where a simulation is to start):
Finish depth: (the depth where a simulation is to end):
Depth increment: WellSim calculates the simulation values at this increment along the wellbore. If too big, the simulation might fail or will be less accurate. If too small, the simulation will take longer and there might be too much data. 50 is usually a good value.
A feedzone (also called a loss zone or permeable zone) is a zone of permeable rock down the wellbore that produces or accepts fluid. In WellSim all such zones are called feedzones:
The lowest feedzone, at or above the wellbottom, is called the deepest feedzone (or just the feedzone). This is handled in an output or an injectivity simulation.
In addition, there may be other feedzones above this, called secondary feedzones. Specify these in the well's secondary feedzones, which will be used for discharge, output, injection and injectivity simulations.
Note:
Only enter the secondary feedzones for a well if it has secondary feedzones (more than one feedzone).
The pressure at a given point down a well varies with mass flowrate; therefore it is possible for a feedzone to produce fluid at some mass flowrates and accept fluid at others. WellSim handles this.
WellSim needs to know the properties of a feedzone, so it can calculate the mass flowrate produced or accepted through the feedzone. WellSim models a feedzone with:
P_res = Undisturbed reservoir pressure at the depth of the feedzone (absolute for Steam, gauge or absolute otherwise)
P_feed = Wellbore pressure at feedzone depth (absolute for Steam, otherwise gauge or absolute)
W = Mass flowrate between the reservoir and the well; positive if the feedzone produces fluid, negative if the feedzone accepts fluid
And:
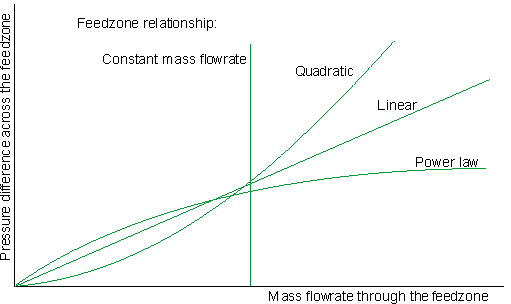
For a discharging well, the reservoir pressure forces fluid into the well, so P_res is greater than P_feed, and the feedzone relationships are:
| Feedzone relationship | Feedzone relationship (for discharge) |
|---|---|
| Linear | P_res - P_feed = a x W |
| Mass flow | W is (fairly) constant |
| Quadratic | P_res - P_feed = a x W + b x W x W |
| Steam | W = c x (P_res x P_res - P_feed x P_feed) to the power of d |
For an injection well, the well pressure forces fluid into the reservoir, so P_feed is greater than P_res, and the feedzone relationships are:
| Feedzone relationship | Feedzone relationship (for discharge) |
|---|---|
| Linear | P_feed - P_res = a x W |
| Quadratic | P_feed - P_res = a x W + b x W x W |
| Power law | W = e x (P_feed x P_feed - P_res x P_res) to the power of f |
Where:
a = Linear factor
b = Quadratic factor
c = Steam factor
d = Steam exponent
e = Power law factor
f = Power law exponent
For example:
For every feedzone you must enter the depth of the feedzone, the feedzone relationship and factors, and usually the reservoir pressure at the feedzone. You will normally find these from downwell measurements. For the feedzone relationship:
Note for an example of modelling a feedzone see here.
For a discharging well, the feedzone relationship and factors are called the drawdown relationship and drawdown factors. For a well injection, the feedzone relationship and factors are called the injectivity relationship and injectivity factors.
Traditionally, the injectivity relationship is assumed to be linear and the number that is estimated from the completion tests is the linear injectivity index, which is the inverse of the linear injectivity factor. This can all be confusing. This help guide uses 'injectivity factor', not 'injectivity index', though WellSim displays both.
A feedzone's drawdown factors are usually different from its injectivity factors, because the permeable rock of the feedzone usually behaves differently if hot water is flowing out or if cooler water is being injected. If you want the secondary feedzone relationships and factors to be different for discharge simulations and injection simulations:
The main use of a discharge simulation is to run output simulations. Before you do this, try to get the discharge simulation as accurate as possible, for example by doing a matching analysis as described here. As better well measurements become available, rerun the discharge simulations and output simulations.
A discharge simulation can be TopDown or BottomUp:
TopDown: Enter measurements or estimates at the wellhead during a discharge test. WellSim calculates the fluid conditions in the wellbore working down to the primary (deepest) feed zone. Usually use TopDown for measurements from actual wells.
BottomUp: Enter measurements or estimates at the deepest feed zone. WellSim calculates the fluid conditions in the wellbore working up to the wellhead. Usually use BottomUp discharge simulations for what-if scenarios read more.
WellSim uses:
some measured or estimated values at the start depth that you specify, usually the wellhead; these are called the initial conditions
the well geometry (such as casing diameter, roughness, deviation)
the well details (secondary feedzones, formation temperature).
WellSim takes the initial conditions and applies the some theoretical and empirical equations (see below) to calculate the conditions at a point a short distance away, along the wellbore. This distance is called the depth increment.
WellSim then takes these calculated conditions, and applies the equations again to calculate the conditions at a new point a further depth increment down the well.
WellSim repeats this until it reaches the finish depth that you specify, usually the depth of the deepest feedzone. The result is the simulation: a list of the conditions along the wellbore.
Note:
The simulation is only in the wellbore where fluid is flowing; therefore:
The simulation does not extend:
Out beyond the wellhead.
In the wellbore below the deepest feedzone. If you specify a finish depth below the deepest feed, WellSim will calculate the correct conditions down to the deepest feed, but the calculated conditions below this will be meaningless.
Out of the well and into the reservoir through the deepest feedzone.
The simulation does not need to know the properties of the deepest feedzone (nor the reservoir pressure at the deepest feedzone).
The simulation does need to know the properties of any secondary feedzones, because these affect the flow of fluid in the well. Specify these in a secondary feedzone dataset for thge well.
WellSim applies some theoretical and empirical equations in order to calculate the conditions along the wellbore.
The theoretical equations are the conservation of mass, the conservation of energy and the conservation of momentum. In addition, where the flow is purely single phase (liquid or dry steam) there are theoretical equations governing the flow. However, there are no such theoretical equations for two-phase flow, and WellSim uses empirical equations developed by engineers. You can choose two types of equation:
Flow correlation: The options are are WellSim, Orkiszewski, Aziz, Hagedorn, Beggs, Duns and Mukherjee. The default correlation, WellSim, was developed for geothermal wells and it handles two-phase and steam fluid. The other correlations come from oil well studies and usually do not handle two-phase and steam fluid well. WellSim is usually the best choice. Another correlation may give a better match if the well discharges liquid.
Equation of state. The options are Simple (simple multiphase (liquid/vapour/gas/solid) thermodynamics) and Complex (complex thermodynamics using (empirical) equations developed by Unocal). Complex is usually best, especially with significant concentrations of gas and or salts.
Note that simulations for deviated wells with two-phase flow are less accurate than for vertical wells, because flow regimes have been studied only for vertical wells. The flow is likely to transition from one regime to another at different physical conditions (pressure/temperature/flow) in a deviated well because gravity will pull the fluid towards the side of the well.
At some points in a wellbore conditions change rapidly, for example at the flash point, where the wellbore changes diameter or at a secondary feedzone. If by chance WellSim's algorithms try to calculate conditions at a depth near such a point, then the calculated conditions can oscillate from one state to another, and WellSim can not calculate accurate conditions. WellSim detects this, stops the algorithm and gives the error Solution did not converge. WellSim uses flow simulations throughout, so this error can happen anywhere in WellSim.
Fix the error by changing the simulation's depth increment slightly.
An output simulation requires data in the wellbore at the deepest feedzone. The simplest way to provide this by specifying a discharge simulation (which contains most of the required data), or else you can just enter data at the deepest feedzone. Discharging a well at a steady state is expensive, so an output simulation is geared to using measurements at only one (maybe two) mass flowrates.
There are three types of output simulations (TopDown, BottomUp or TestData); use the one appropriate to the measurements that you have and what you want to achieve:
TopDown for data from actual wells read more. This requires one (maybe two) TopDown discharge simulations.
BottomUp for what-if scenarios, for example to find how the output curve changes with changes in reservoir pressure read more. This requires one (maybe two) BottomUp discharge simulations.
TestData if you have estimates or measurements at the deepest feedzone. Normally use TestData to calculate a preliminary output curve from injection measurements from a well's completion tests read more.
Use TopDown output simulations to calculate output curves for actual wells.
For a TopDown output simulation:
Select a discharge test type of TopDown.
WellSim always calculates the drawdown factors.
You must enter real measurements from a well that has been drilled; you can not change any measurements to run a what-if scenario.
Specify most of the required data by specifying one (maybe two) TopDown discharge simulations; these must be for an actual well:
| Drawdown relationship | Specify |
|---|---|
| Linear | One TopDown discharge simulation |
| Quadratic | Two TopDown discharge simulations |
| Steam | One TopDown discharge simulation, plus enter the steam exponent |
Use BottomUp output simulations to model the effects of future changes in the well or field (what-if scenarios). For example, you can find the effect on the output curve of a different wellbore diameter or the effect of a different reservoir pressure.
For a BottomUp output simulation:
Select a Discharge test type of BottomUp.
WellSim can calculate the drawdown factors, but usually enter them.
You can enter real measurements from a drilled well, or you can change some measurements to run a what-if scenario.
Specify most of the required data by specifying one (maybe two) BottomUp discharge simulations; these can be made using real measurements from a drilled well, or you can change some measurements to run a what-if scenario:
| Drawdown relationship | Specify |
|---|---|
| Linear | One BottomUp discharge simulation |
| Quadratic | Two BottomUp discharge simulations |
| Steam | One BottomUp discharge simulation plus the steam exponent |
A BottomUp output simulation has several options. Until you become familiar with output simulations, we suggest using BottomUp output simulations for what-if scenarios by following these steps (these are for Linear and Steam; for Quadratic, create two BottomUp discharge simulations):
Make a copy of an existing TopDown discharge simulation for the well and open the copy for editing.
Change Test Direction to BottomUp.
Change some of the discharge simulation's data to suit your what-if scenario. For example, to find the effect of a different wellbore diameter, change the geometry configuration to a new one, with different diameters. You must assume that the data you change would not affect any of the data you don't change.
Run the BottomUp discharge simulation.
Create a new BottomUp output simulation:
Specify your new BottomUp discharge simulation.
Un-tick Calc Drawdown and enter drawdown factors for deepest feedzone; usually use factors that WellSim has calculated for an earlier TopDown output simulation for the well.
Enter other data to suit your what-if scenario, for example enter the known reservoir pressure or, if your what-if scenario involves a different reservoir pressure, enter a different pressure.
Run the BottomUp output simulation.
There are different degrees of what-if scenario:
The trivial case is that you use actual well data. The resulting output curve from the BottomUp simulation should be the same as the output curve from the earlier TopDown simulation see this tutorial.
In a more practical cases, you will change one piece of data and compare the original and changed output curves. This is described in these tutorials:
Less often, you will change more than one piece of data. For example, you could find the effect of changing both the reservoir pressure and the well geometry. And the feed relationship and factors.
Normally use a TestData output simulation to calculate a preliminary output curve from injection measurements from a well's completion tests, see this tutorial. You could use a TestData output simulation for what-if scenarios, but it is usually simpler to run a BottomUp output simulation, described above.
For a TestData output simulation:
Select a discharge test type of TestData.
You must enter the drawdown factors for deepest feedzone.
You can enter the real measurements from wells that have been drilled, or you can change some measurements to run a what-if scenario.
You can not choose a Quadratic drawdown relationship.
An output simulation calculates conditions from the undisturbed reservoir up to the wellhead for a range of mass flowrates. Therefore, the output simulation needs to know information about:
The reservoir: reservoir pressure, a fluid parameter (enthalpy, temperature or dryness), fluid solid and gas impurities (assumed to be constant between the reservoir and wellhead.
The feedzone: drawdown relationship and factor(s).
The well: geometry, any secondary feedzones, any formation temperatures.
An output simulation proceeds like this:
If it can and if you ask it to, it will calculate the drawdown factors. For a linear simulation:
a = (P_res - P_feed) / W
and P_res - P_feed must obviously be at the flow rate W.
It runs BottomUp discharge simulations from the undisturbed reservoir, across the deepest feedzone and up the well to the wellhead for the range of mass flowrates that you specify. For each mass flowrate:
First, it calculates the pressure in the well at the deepest feed. For a Linear simulation:
P_feed = P_res - a x W
Where W and P_feed are for the particular flow simulation being run.
Then it does a BottomUp discharge simulation, using this data:
For the two fluid parameters: P_feed calculated above and the parameter you select to be the Constant Parameter; usually enthalpy because it is easiest to estimate.
For the fluid impurities: values you enter for the output simulation.
For the well data: a geometry configuration, the secondary feedzones (if the well has any secondary feedzones) any formation temperatures. For TopDown and BottomUp output simulations, WellSim extracts these from the discharge simulation that you specify.
Finally, it extracts from these BottomUp discharge simulations data (in particular pressure) at the wellhead and at the deepest feed, which it stores as the output simulation. Then it deletes these BottomUp discharge simulations.
An injection simulation is similar to a discharge simulation, except the fluid goes into the well:
An injection simulation can be TopDown (for real data) or a BottomUp (for what-if scenarios).
An injection simulation requires injection measurements of pressure and temperature (or enthalpy) at one mass flowrate. Usually make wellhead measurements when a new well is injected at relatively low pressure during completion tests.
Things to do with an injection simulation:
Use one (maybe two) injection simulations to run an injectivity simulation read how.
Get an idea of downhole pressures likely in the well.
Use a TopDown injection simulation to create a BottomUp injection sumulation, so the injectivity simulation can calculate the deepest feedzone factor(s) for you.
An injectivity simulation is similar to an output simulation, except the fluid goes into the well.
During a well's completion tests, it is easy to inject a well at several relatively low wellhead pressures and measure the mass flowrates; an injectivity simulation is geared to use these measurements. The result of the injectivity simulation is also wellhead pressure and mass flowrates. In effect, what WellSim does is to extrapolate the low-pressure measurements to higher pressures and mass flowrates.
For injectivity, the feedzone relationships and factors are called injectivity relationships and factors/indexes read more.
An injectivity simulation can be TopDown, BottomUp or TestData, see below. Normally choose TestData.
The injectivity relationship can be Linear, Quadratic or Power Law read more. Normally choose Linear.
For injectivity simulations for free-flowing injection wells, where the pressure at the top is zero or close to zero, see here.
Choose TestData, TopDown or BottomUp depending on the measurements you have and what you want to achieve. It is usually best to make measurements so that you can choose TestData, because this will calculate the injectivity factors and the reservoir pressure. TopDown or BottomUp require you to estimate reservoir pressure, and it is hard to do this straight after drilling, when pressure near well is likely to be considerably higher than the actual reservoir pressure.
When to choose TestData:
TestData is usually the best choice. Choose TestData when you:
Enter the injection measurements into a measured injectivity curve and use this for the injectivity simulation read how:
The simulation effectively averages the pressure/mass flowrate measurements, so the more measurements you have the more accurate it will be.
Graph the measured injectivity curve, imagine a line of best fit and delete any obviously bad points.
You might suspect secondary loss zones from:
fluid losses during drilling
the way the well heats up or cools down: a loss zone cools down much more during drilling (as the drilling fluid invades the region) and usually heats up much faster
the field's geology
if there are feedzones in nearby wells
Fluid loss at a secondary loss zone will slightly affect the downhole pressure and temperature profiles but will strongly affect the apparent injectivity factor at the deepest feedzone.
When to choose TopDown:
Choose TopDown if you only have measurements at one or two mass flowrates for an actual well, or you suspect there are secondary losszones. Use the measurements to run one or two TopDown injection simulations, then use them for the TopDown injectivity simulation read how.
The accuracy of a TopDown injectivity simulation depends on the accuracy of its TopDown injection simulation(s). If you have pressure measurements at several mass flowrates:
When to choose BottomUp:
Choose BottomUp if you want to run what-if scenarios, for example to find how the injectivity curve changes with changes in reservoir pressure. The general method is the same as for a what-if scenario for an output simulation read more, and you need to run one or two BottomUp injection simulations first.
Note:
| Injection Test Type | Injectivity factors | Reservoir pressure |
|---|---|---|
| TopDown | Is calculated | Specify |
| BottomUp | Is calculated or specify | Specify |
| TestData | Is calculated or specify | Is calculated or specify |
Choose Linear, Quadratic or Power Law. Normally, choose Linear unless:
the relationship for nearby wells is otherwise
the shape of the measured injectivity curve strongly suggests otherwise, see below.
If friction is low, then the shape of the measured injectivity curve will be the same as the shape of the pressure/mass flowrate curve at the deepest feedzone (the injectivity relationship). And therefore you can find the injectivity relationship from the shape of the measured injectivity curve:
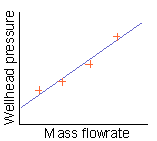
For your measured injectivity curve, look at a quickgraph of pressure (left axis) against mass flowrate (bottom axis).
Imagine a straight line fitted to the points on the graph (and not through the 0,0 point of the graph). In the diagrams below, your imagined line is purple and the orange crosses are your measured injectivity points.
Then:
If the points on the graph look like they are on the straight line or if they are too scattered to make sense of, choose Linear:
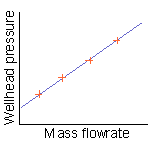
If the points on the graph look like they curve up, choose Quadratic:
If the points on the graph look like they curve down, choose Power Law. Power Law is not likely:
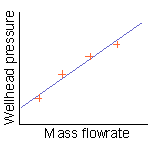
Power Law requires you to enter a power law exponent, in the range 0 to 1, which determines how sharp the curve is:
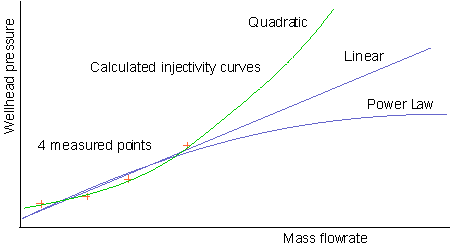
There are four measurements on the measured injectivity curve:
The points look like they curve up fairly steeply, so choose Quadratic. When you run the injectivity simulation, WellSim will calculate an injectivity curve like the green line, which passes fairly well through the four points.
If you choose Linear or Power Law, WellSim will calculate an injectivity curve (a purple line) that does not pass through the four points; it is innaccurate.
Friction can be significant for a well injection, and increases with mass flowrate see here. This causes the measured injectivity curve to curve up relative to the pressure/mass flowrate curve (the injectivity relationship) at the deepest feedzone as the mass flowrate increases. For example, a Linear injectivity relationship will give rise to a quadratic measured injectivity curve.
The measured injectivity curve is usually measured for low mass flowrates, and the measurements are often not reliable. Therefore it tends to look Linear, regardless of the actual injectivity relationship.
Therefore, Linear is usually a good choice because it is simpler.
An injectivity simulation is essentially the same as an output simulation. However, a TestData injectivity simulation is different to a TestData output simulation because:
You supply wellhead data, not deepest feed data as for an output simulation.
It can calculate the reservoir pressure, like this:
For each set of wellhead pressure, flowrate and temperature that you enter, WellSim does a TopDown injection simulation to find the pressure at the deepest feedzone for that flowrate.
WellSim fits a curve (the injectivity relationship) to its set of pressure/flowrate points at the deepest feed. This tells WellSim the injectivity factors.
WellSim extrapolates the curve back to a flowrate of zero; the pressure there is the reservoir pressure.
You can also specify the reservoir pressure; WellSim will fit the injectivity curve through this point. Caution if your reservoir pressure is wrong, the injectivity simulation will not be accurate. It is usually better to let WellSim calculate the reservoir pressure, as above.