Introduction
Tutorials
Improving a discharge simulation
A lower bound analysis analyses a measured discharge profile for a well, and you can use the results to estimate:
Impurity content (NaCl or CO2) in the well.
Measurement errors in the measured discharge profile.
The depths of secondary feed zones.
Note
W:100 t/hr that you should have entered earlier.The lower bound analysis looks at pairs of pressure and temperature measurements at the same depth and that are two-phase. For each pair:
It takes the temperature and calculates the saturation pressure of pure water at that temperature.
It compares that pure water saturation pressure with the measured pressure. The two pressures are not usually the same, because a typical well fluid has solids (usually NaCl) and gasses (usually CO2) dissolved in it.
If the pure water saturation pressure is more than the measured pressure, then NaCl dominates CO2, and it calculates the minimum amount of NaCl present.
If the pure water saturation pressure is less than the measured pressure, then Co2 dominates NaCl, and it calculates the minimum amount of CO2 present.
Depending on the data you provide for the lower bound analysis, it can also calculate the flashpoint PC, the flashpoint saturation pressure and the flashpoint pressure.
The lower bound analysis graphs these calculations as a function of depth. You can use the results in several ways:
The values of CO2 or NaCl present, flashpoint PC, the flashpoint saturation pressure and the flashpoint pressure should be the same for each depth. If they are not then this shows that some measurements have errors.
To estimate the minimum amount of CO2 or NaCl present.
To estimate the depths of secondary feedzones.
Measure all depths relative to the same point at the wellhead read more.
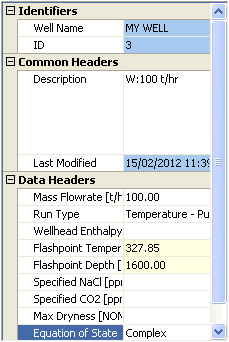
This lower bound analysis will be of run type Temperature pure, which requires you to enter the flashpoint temperature and depth. You can find these from the knee in the measured discharge profile graph:
In the sample database for MY WELL, right-click the measured discharge profile W:100 t/hr and click Edit.
Click 
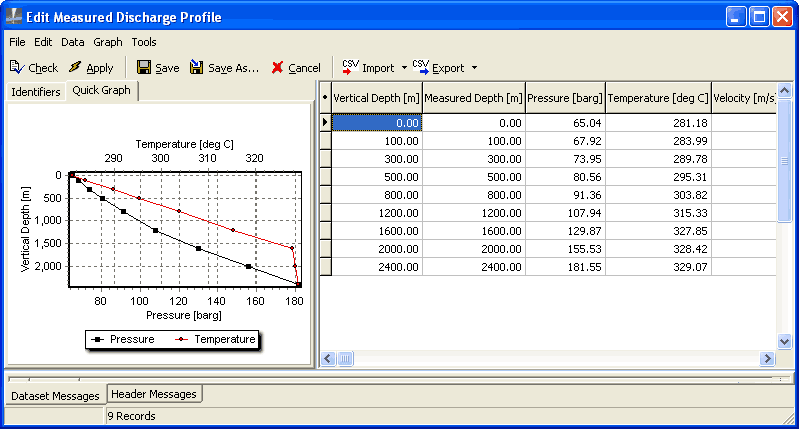
Note the depth of the knee in temperature curve, 1600 m (this is the flash point). Look at the data table and note the temperature at this depth, 327.85 degrees.
Click 
In the sample database, select  and click
 Lower bound analysis. The window shows the measured discharge profiles that you have entered; these profiles are automatically available for lower bound analysis.
Right-click the lower bound analysis W:100 t/hr and click Edit.
Enter this data for the analysis (which includes the two measurements you noted above):
Click  to run the analysis.
Click Lower bound graph to display:
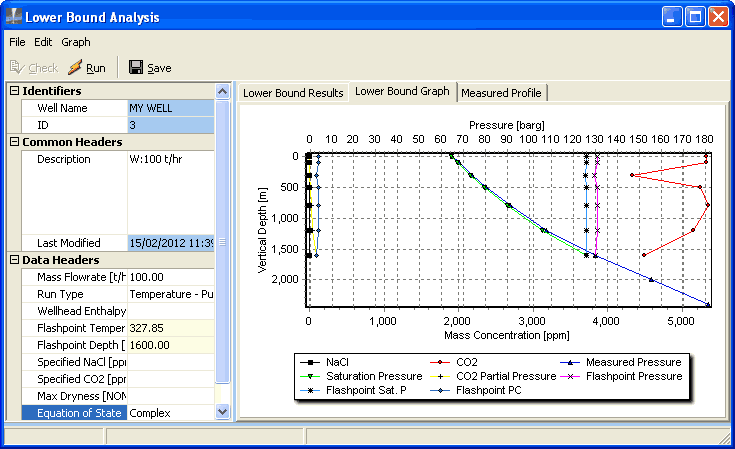
If your graph does not look like this, change it.
The lower bound analysis calculates results from depth 0 to 1600 m, because it only works for two-phase measurements. Below the flashpoint at 1600 m the flow is liquid.
The saturation pressure is always smaller than the measured pressure (by the CO2 partial pressure), indicating that CO2 dominates NaCl.
The values of CO2, flashpoint PC, the flashpoint saturation pressure and the flashpoint pressure should be the same for each depth. They are approximately the same, except for the values at 300 m, which all show a discontinuity. This suggests there is an error in the measurement at 300 m.
The line for CO2, discounting the value at 503 m, shows a CO2 concentration of around 5200 ppm. This is higher than the value assumed for the discharge simulation, which was 4000 ppm.
Click  .
.
Lower bound analysis is a simple tool for examining trends in measured discharge profiles. The process works on pairs of pressure and temperature measurements taken down the well. Requirements:
To be considered "pairs" of pressure and temperature, each measurement in the pair must be at the same depth.
The analysis is only valid on pairs that are two-phase, and not pairs that are for liquid, or superheated steam
Lower bound analysis takes each two-phase pressure and temperature pair, and determines whether the measured pressure value paired with the measured temperature value is greater than or less that the theoretical saturation pressure at that temperature.
If the pair of values do represent two-phase conditions, and the measurements have been taken accurately, then a pressure value which does not equal the pure water saturation pressure implies that the water is not in fact "pure", and must include impurities.
If the pressure measurement is less that the pure water saturation pressure then there must be some NaCl in the fluid to depress the pressure. The minimum amount of NaCl required to cause such a drop in pressure occurs when it is assumed that no CO2 exists in the fluid. The value is termed the "NaCl lower bound" value which does not equal the pure water saturation pressure implies that the water is not in fact "pure", and must include impurities.
The most common impurities in geothermal fluid are usually represented by equivalent contents of NaCl or CO2. NaCl on its own has the effect of depressing the fluid's saturation pressure, whereas CO2 on its own has the effect of raising the overall fluid pressure. When in combination, the "salting out effect" of the NaCl produces an increase in bubble point pressure (i.e. the point at which bubbles of vapour first appear due to flashing of the liquid) that is greater in fact that would be observed due to the CO2 acting alone.
Systems containing either impurity have a saturation "envelope" rather than a saturation "line". The envelope is bounded by the bubble point line, and the dew point line (i.e. the point at which droplets of liquid first appear in the vapour). For a pure water system, the bubble points and dew points are the same. Where impurities are present, the saturation pressure is dependent on not just the saturation temperature, but also on the fluid composition and the relative distribution of fluid between the liquid and vapour phases. Therefore, the three component system of H20-C02-NaCl exhibits highly ideal and non-linear saturation behaviour.
The variation in measured pressure against pure water saturation pressure may in fact be due to impurities in the fluid, however it is not possible to predict from any measurement pair the quantity of both NaCl and CO2 content present, (although if one is measured with accuracy, and therefore considered to be known, then the other can be estimated). However, it is possible to determine a "lower bound" to the equivalent quantity of either one or the other, if it is assumed that only one of the impurities is present. For example:
If the pressure measurement is less that the pure water saturation pressure then there must be some NaCl in the fluid to depress the pressure. The minimum amount of NaCl required to cause such a drop in pressure occurs when it is assumed that no CO2 exists in the fluid. The value is termed the "NaCl lower bound".
Conversely, if the pressure measurement is greater than the pure water saturation pressure then there must be some CO2 in the fluid to produce the higher pressure. There could also be NaCl in the fluid as well. The amount of CO2 required to cause such an increase in pressure when it is assumed no NaCl exists in the fluid is termed the "CO2 lower bound".
For a particular pair of pressure and temperature measurements compared against pure water saturation conditions, there can only be either an NaCl lower bound, as they are mutually exclusive. The set of lower bound values (regardless of whether they are NaCl or CO2 bounds) found from pairs of measurements down the wellbore is termed a lower bound profile. The process of estimating a discharge profile's associated lower bound profile is termed lower bound analysis.
Lower bound analysis not only can compare the pressure/temperature pairs against the saturation conditions of pure water, but also against the saturation conditions of a two component system of water and CO2, or of a two component system of water and NaCl. In such as case, a base quantity of either CO2 or NaCl is already considered to be present in the fluid. The lower bound values are now the minimum amount of either impurity required in the fluid to produce the measured saturation conditions, given that the other impurity is also present in some specified quantity.
Data consistency checking is the main purpose of lower bound analysis. Although the impurity estimates provided may be useful in narrowing down a suitable input parameter for either representative impurity, the accuracy of the estimate is dependent on the accuracy of the measurement pairs.
If the measurements are completely accurate then there should only be small variations in the lower bound estimates down the well. If both impurities are present in significant quantities then it is essential that a base value of either NaCl or CO2 is specified as being present in the fluid, so that the lower bound value of the non-specified impurity can be calculated satisfactorily.
Generally downhole measurements are subject to error. If these measurements are used in matching analysis to calibrate well input parameters then it is important to assess their associated error. Lower bound profiles down a wellbore where the fluid is pure water may still exhibit both NaCl and CO2 lower bounds in the two-phase flow region. In this case the lower bounds are due to the pressure value being different from the pure water saturation pressure because of pressure or temperature measurement error.
If the lower bound profile displays distinct "spikes" in the profile, then the pressure/temperature pairs at that depth can be considered to be particularly inaccurate measurements, and should be removed from the discharge profile data prior to use in matching analysis. Otherwise it might appear that a particular match is poor, but the reason for the poor fit is not the simulation results, but the measured data used for the comparison. If there are no distinct trends and the lower bound profile is highly variable, then it is suggested that the entire discharge profile not be used for matching analysis all.
If the lower bound profile displays a distinct sloping trend, then this may indicate that both NaCl and CO2 are present in significant quantities, and therefore that a base quantity of one or the other impurity should be specified.
The above applications assume that no large variations are likely to be observed in the lower bound profile down the well if the measurements are fairly accurate. This is because physically the relative quantities of NaCl and/or CO2 do not change up the wellbore, and so the effects on the fluid pressure with respect to temperature should show a distinct trend. However, NaCl and/or CO2 content can change their concentrations in the well about secondary feed zones. The fluid at and below any feed does not necessarily have the same concentration, or even the same relative concentration of either impurity. For this reason it would be expected that a "discontinuity", or "jump", in the lower bound profile might be observed about the depth of a secondary feed zone. This can in fact be the case, as long as there are enough measurement pairs on either side of the feed for the "jump" to become evident.
If the measurement pairs of pressure and temperature are "accurate" then lower bound analysis can be used to estimate feasible ammounts of NaCl or CO2 in the fluid. This may help to calibrate the values of NaCl or CO2 entered into WellSim as the input parameters for a discharge test, or to confirm which measured value of impurity content to use where values have varied dependingon the time when they were taken, or due to other reasons.
Because a base value of either impurity can be specified as being present in the fluid, the method allows the concentrations of both NaCl and CO2 to be evaluated that best correspond to the observed pressure and temperature conditions.
It is important to remember that lower bound values determined in regions of the wellbore that are not two-phase flow are not valid. This is because the pressure differences are due to the state of the fluid in addition to the effects of any impurities. This application of lower bound analysis should be used with caution, as the data should first be checked for consistency, and only then should the actual magnitudes of the lower bound values be considered.