Introduction
Tutorials
Getting familiar with GeoData Manager
Changing how GeoData Manager looks
Scenarios for using GeoData Manager
Data types and nodes
Help with data types and nodes
Getting familiar with GeoData Manager
Changing how GeoData Manager looks
Scenarios for using GeoData Manager
Help with data types and nodes
Contents:
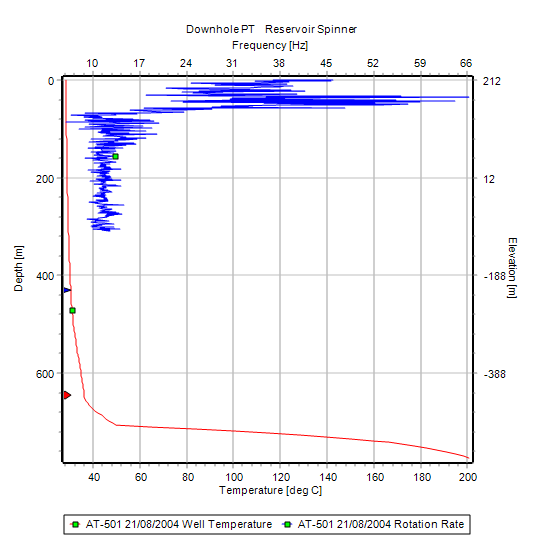
This graph is available at these nodes:
Reservoir > Downhole PT.Reservoir > Spinner.Downhole Logging > Spinner.Note
Well Test Type = PT-S at the Downhole PT node, or for data with Well Test Type = SPIN-PT at the Spinner node.To create this graph, proceed as follows:
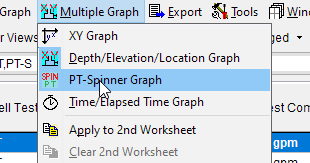
Well Test Type = PT-S, and have corresponding data at the Spinner node, with identical Well, Well Date and Test Start Time / ID values, and Well Test Type = SPIN-PT.Click on Multiple Graph > PT-Spinner Graph.
If there is no corresponding data, an error message will be displayed. Otherwise, a single graph showing Temperature and Rotation Rate will be displayed.
Well Test Type = SPIN-PT, and have corresponding data at the Downhole PT node, with identical Well, Well Date andTest Start Time / ID values, and Well Test Type = PT-S.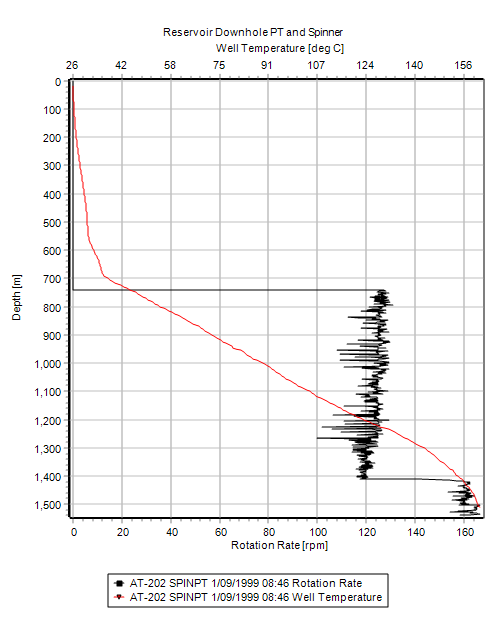
If you wish to plot Temperature and Spinner data with different identifiers on the same graph, proceed as follows:
Spinner-PT Graph, click on Multiple Graph and select Depth/Elevation/Location Graph. Press Cancel to exit the warning message.Multiple Graph and on Apply to 2nd Worksheet.Click on Depth/Elevation/Location Graph.
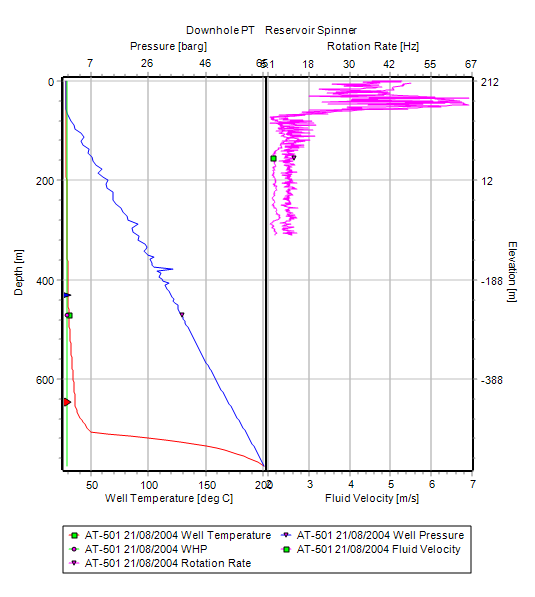
Now click on Settings, and change the Unit Types of the top and bottom axes, so that Rotation Rate is at the top of one graph, and Temperature is at the bottom of the other graph, and the Unit Types of the other top and bottom axes are set to None.
Check the Merge Graphs box and press OK to create a single plot.
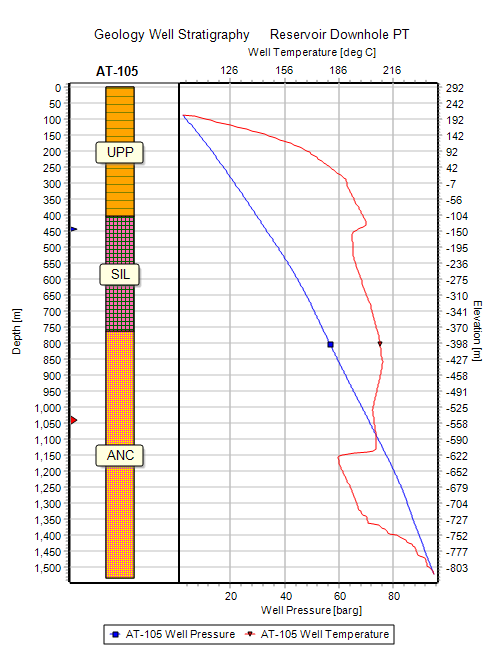
To create a double graph of a lithology column and downhole PT data, proceed as follows:
Reservoir > Downhole PT and tag the data you wish to plot.Multiple Graph and then click on Apply to 2nd Worksheet.Geology > Well Stratigraphy and tag the stratigraphy data you wish to plot.Formation Column to create a multiple graph of stratigraphy and pressure/temperature.Settings and open the Worksheet1: Well Stratigraphy tab.Bar Offset % box to move the stratigraphy away from the left axis.Show label text box to write the formation code on the column (at present there is no separate Stratigraphy legend in this graph).Divider Position % tab to widen the right-hand graph.Visible Fields panel apart from Well Temperature and Well Pressure.Schema, open the Colour Order tab and set the first Pen ID to 1 and the second to 2.OK in Schema and OK in Settings to obtain the graph below.