Introduction
Tutorials
Getting familiar with GeoData Manager
Changing how GeoData Manager looks
Scenarios for using GeoData Manager
Data types and nodes
Help with data types and nodes
Getting familiar with GeoData Manager
Changing how GeoData Manager looks
Scenarios for using GeoData Manager
Help with data types and nodes
Contents:
| If you want to | ... then try this |
|---|---|
| learn more about graphs | read on |
| display a graph | look here |
| change how a graph looks | look here |
Graphs are an important part of GeoData Manager, and there are many options to configure the graph, and to import, export and print the graph. There are two types of graph:
Quick Graph An easy-to-use graph of numbers in one data set.
Multiple Graph Can display data from one data set, from several data sets of the same data type or from several data sets of two different data types.
Follow these steps to customise and then use a graph. Note that Multiple Graph stores default values for many options and will guess options you might need, so in practice you might be able to omit some of these steps:
Select the data sets to display and click Quick Graph or Multiple Graph read how.
Set up the graph axes to have the right names and orientation,
and,
select the series (curves) to display (the series available depend on the data available in the selected data set(s)) read how.
While looking at a graph you can quickly zoom and scroll the view, and change axis units on the fly read how.
If necessary, customise how the graph looks read how.
Do something with the graph: in addition to looking at the graph, you can print it or export it in many formats, for example as a graphic, as numbers, as XML or as a text file read how.
If required, use special graph procedures:
Transforms These apply a mathematical or scientific function to a series, to produce a new series. For example, you can take a pressure series and calculate a new saturation temperature series.
Time Calcs Compare time-dependent series that have different start times.
Export the graph data to a file of numbers.
Import data to graph from a a file of numbers.
Manually enter your own data to graph, rather than selecting data sets in WellSim.
This section shows you how to select data set(s) to graph and to display the graph, either a Quick Graph or a Multiple Graph:
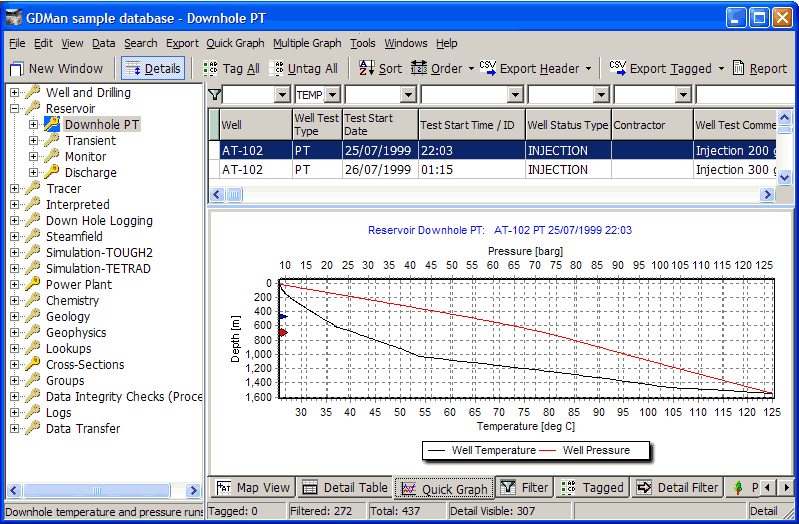
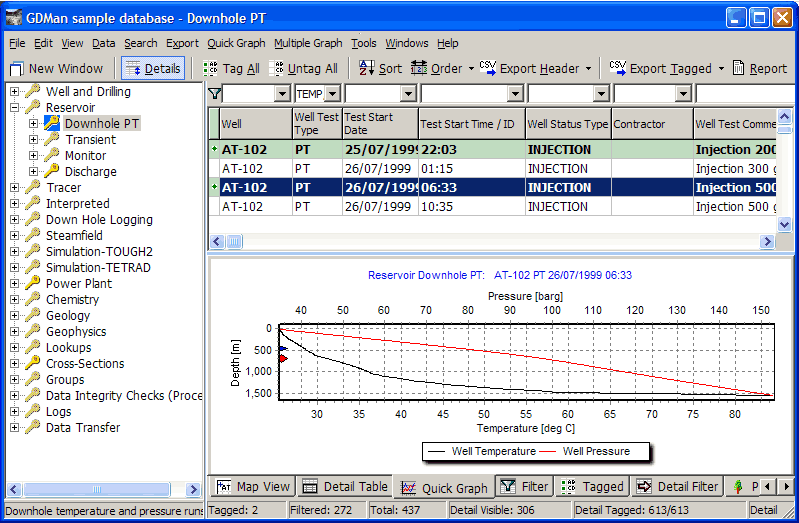
Displaying a Quick Graph of a downhole PT test:
In the sample database, navigate the database tree to Reservoir > Downhole PT.
In the header window, click the first row to select it.
Click the Quick Graph tab to display the quick graph:
Displaying a Quick Graph of a downhole PT test:
Go to edit the first downhole PT test: In the header window, right-click the first row and click Edit in the menu.
Click the Graph tab (top left of window) to display the quick graph:
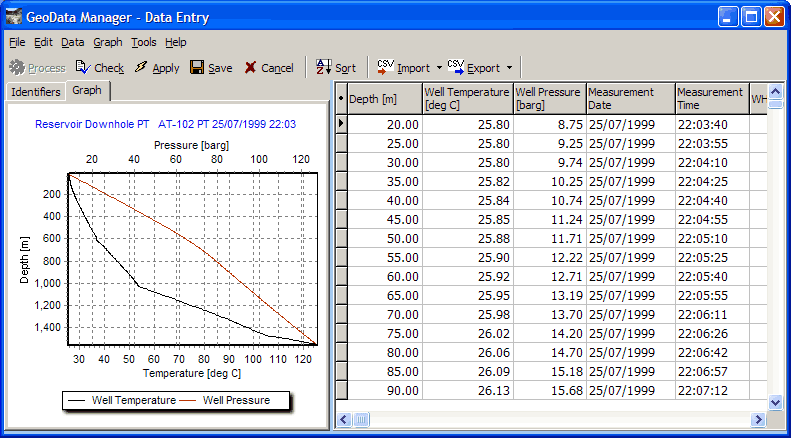
Click Cancel to close the edit window.
Displaying a Multiple Graph of a downhole PT test:
Tag the first row in the header window: double-click the row:
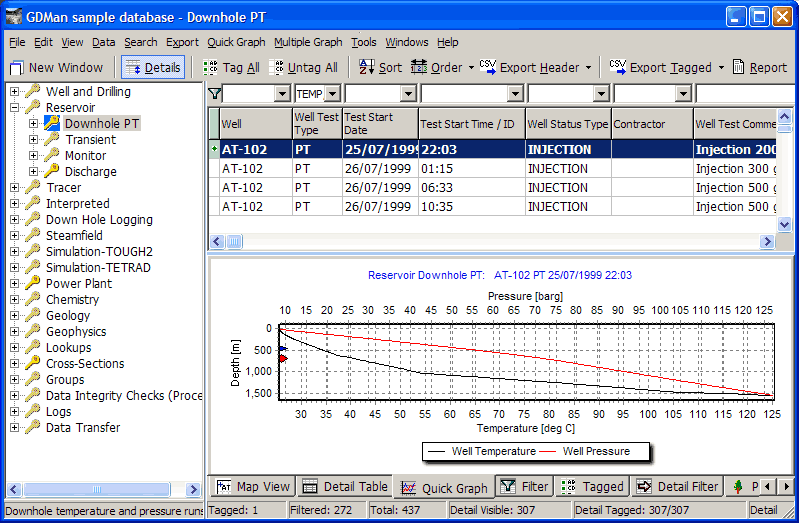
To display the Multiple Graph
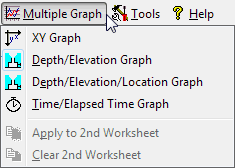
either click the  beside
 Multiple Graph in the toolbar and click the kind of Multiple Graph you want
or click Multiple Graph in the menu bar and click the kind of Multiple Graph you want
or click Multiple Graph in the toolbar (this displays the same kind of graph that you used last time; to see this kind, hover the mouse over the button):
To exit Multiple Graph, click Return.
Displaying a Multiple Graph of two downhole PT tests:
Tag another row in the header window:
Click Multiple Graph in the toolbar:
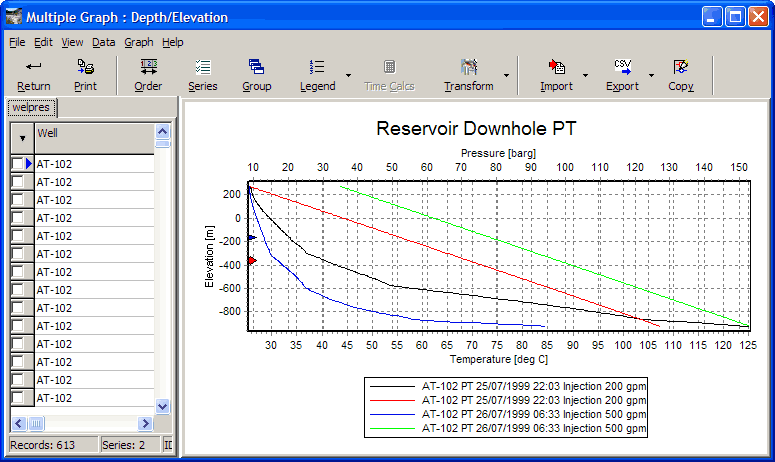
To exit Multiple Graph, click Return.
Here, the independent and dependent axes must be compatible:
Displaying a Multiple Graph of a downhole PT test and an interpreted measured discharge profile:
Untag the second row you tagged above: double-click the row.
Click Multiple Graph in the menu bar, then click Apply to 2nd Worksheet. This tells Multiple Graph that you want to use this profile in a later Multiple Graph:
Navigate the database tree to Interpreted > Temperature.
Tag the row for well AT-102, the well you used above.
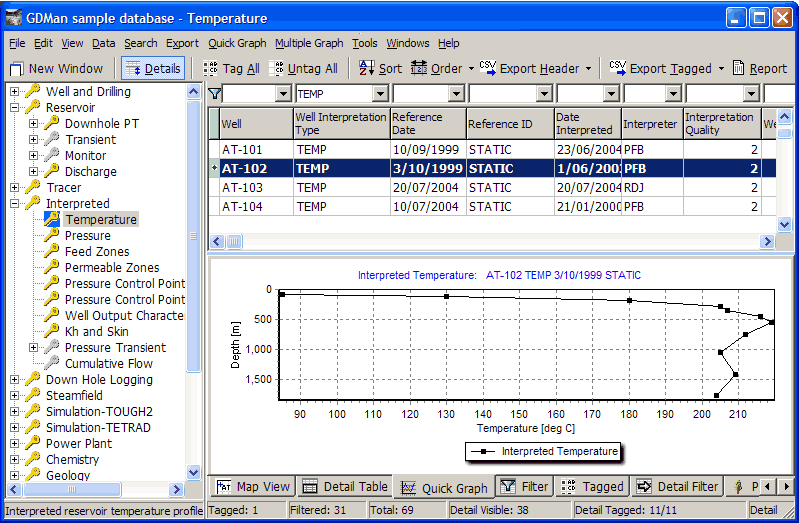
Click Multiple Graph in the toolbar:
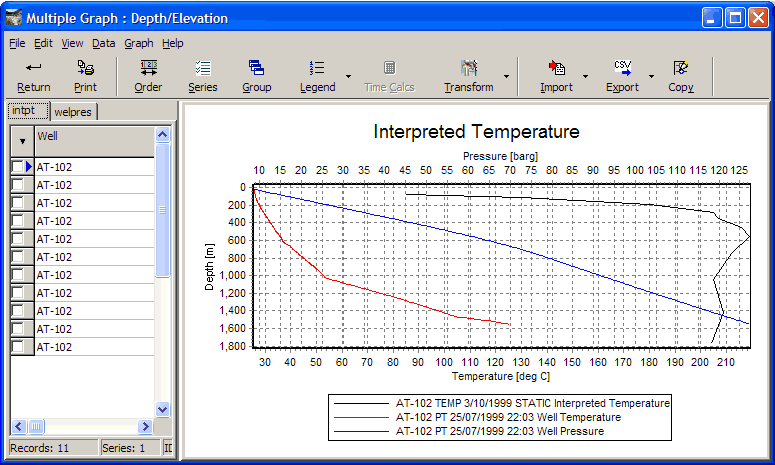
To exit Multiple Graph, click Return.
Click Multiple Graph in the menu bar, then click Clear 2nd Worksheet. This tells the Multiple Graph to ignore the downhole PT test you selected earlier (by Apply to 2nd Worksheet).
Here, the independent axes must be compatible but the dependent axes can be incompatible. For example:
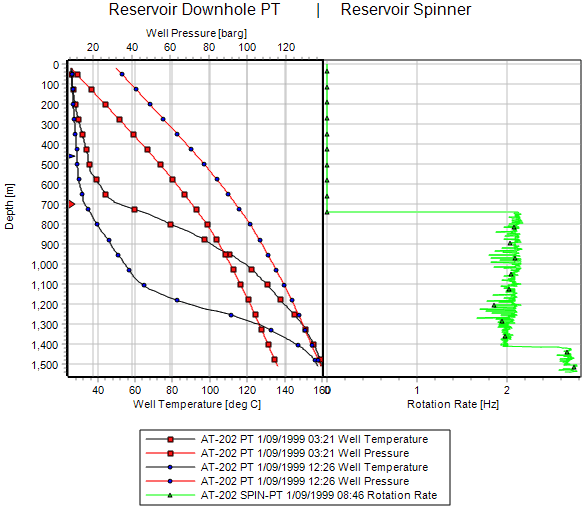
Displaying a Multiple Graph of downhole pressure and temperature on one line graph and downhole spinner data on the other line graph. This is similar to a Multiple Graph of two data sets of compatible types above:
At the node Reservoir > Spinner, tag the data set for AT-202.
Click Multiple Graph in the menu bar, then click Apply to 2nd Worksheet.
At the node Reservoir > Downhole PT, tag a couple of data sets for AT-202.
Click Multiple Graph in the toolbar. If necessary, now go to Multiple Graph settings and in the spinner tab, select suitable dependent axes:
When you zoom such a graph a lot, the series can overlap to show more detail:
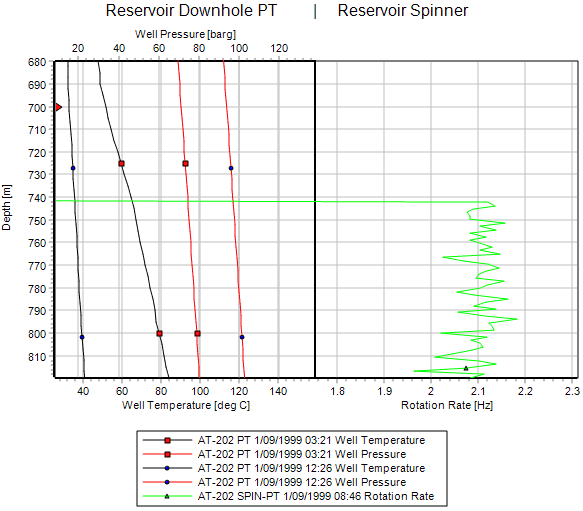
To exit Multiple Graph, click Return.
Click Multiple Graph in the menu bar, then click Clear 2nd Worksheet.
Quick and Multiple Graphs of well lithology, stratigraphy, alteration and interpretation display as geology column graphs, with different colours and patterns for the different rock types, for example:
At the node Geology > Well Alteration, click on a line, then click the Quick Graph tab:
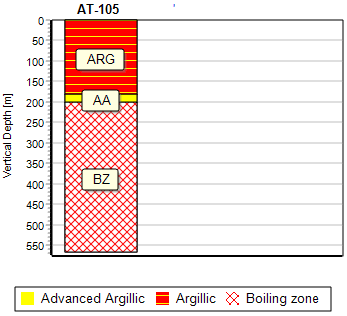
At the node Geology > Well Stratigraphy, tag 3 lines, then click Multiple Graph:
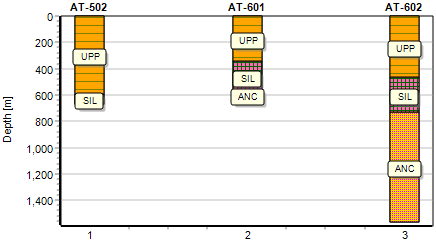
For a tutorial on setting up a geological column graph see here.
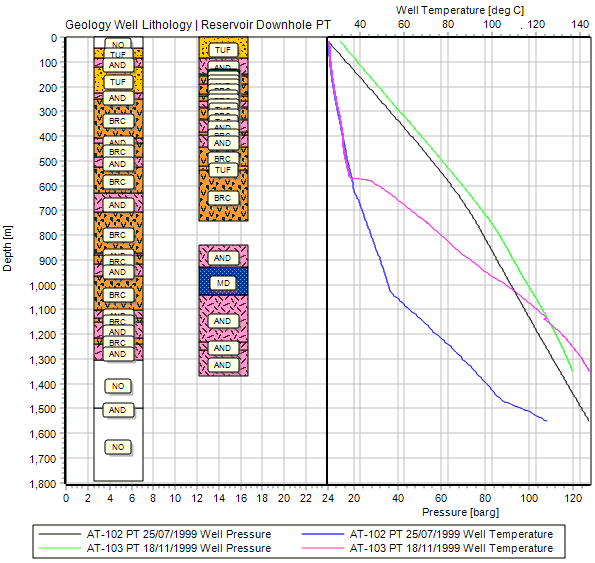
For this combination, tag data sets for the line graph first and apply to second worksheet, then tag the geology datasets to use.
At the node Reservoir > Downhole PT, tag the first data set for AT-102 and the first data set for AT-103.
Click Multiple Graph in the menu bar, then click Apply to 2nd Worksheet.
At the node Geology > Well lithology, tag the data sets for AT-102 and AT-103.
Click Multiple Graph in the toolbar. If necessary, now go to Multiple Graph settings and:
Downhole PT tab, select suitable dependent axes.Well Lithology tab, turn off comments.The result is:
To exit Multiple Graph, click Return.
Click Multiple Graph in the menu bar, then click Clear 2nd Worksheet.
When you go to display a Multiple Graph, you can select a kind of graph you want or use a default:
either click Multiple Graph in the toolbar: this displays the default graph for this node, which is usually the one you want (to see what kind it is, hover the mouse over Multiple Graph):
or click the beside Multiple Graph in the toolbar and click the kind of Multiple Graph you want
or click Multiple Graph in the menu bar and click the kind of Multiple Graph you want.
The kind of graph you select determines:
The default settings for the graph - GeoData Manager does its best to display the kind of graph you want
Which calculated data fields will be added to the worksheet, for example depths and elevations of the data down a well (see below).
Once in Multiple Graph, you can change the settings to rearrange the graph to look how you want, and you can use any worksheet fields in the graph, including calculated. You can not easily add data fields to the worksheet.
For the examples below, I went to Geology: Well Lithology, tagged all data sets, then started each kind of Multiple Graph available.
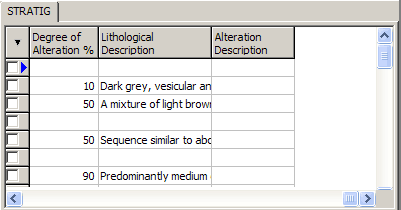
X/Y Graph Does not add any calculated fields to the worksheet:
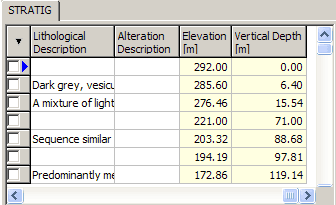
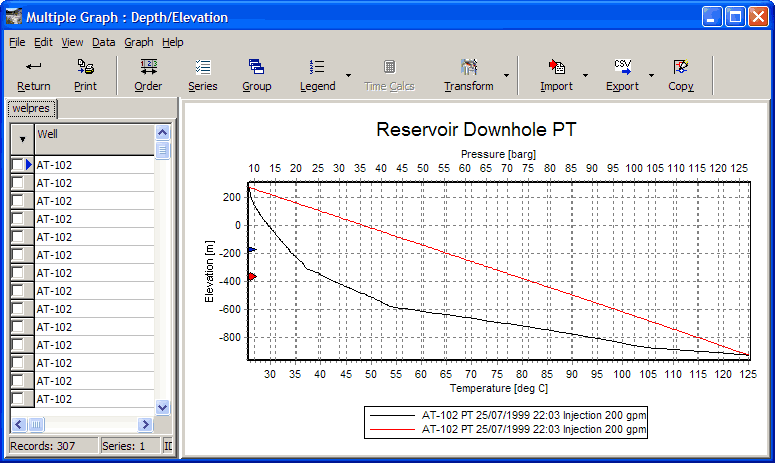
Depth/Elevation Graph Adds elevation and depth to the worksheet:
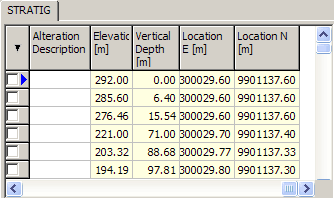
Depth/Elevation Graph Adds elevation, depth and location to the worksheet:
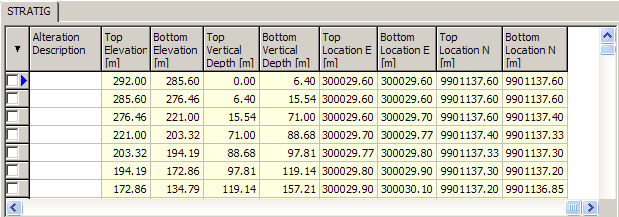
Geological Column Graph Adds the depths and locations of the columns (strata):