Introduction
Tutorials
Getting familiar with GeoData Manager
Changing how GeoData Manager looks
Scenarios for using GeoData Manager
Data types and nodes
Help with data types and nodes
Getting familiar with GeoData Manager
Changing how GeoData Manager looks
Scenarios for using GeoData Manager
Help with data types and nodes
Now you have data sets entered and selected, you can do something with them:
| Toolbar shortcut | See here |
|---|---|
 |
Export data sets to a file. |
 |
Print a report of data from different sites. |
 |
Graph data sets. |
 |
Output a horizontal slice of data from different sites to a file. |
 |
Output a slice of data on a vertical cross-section to a file. |
 |
Output data in a range of specialized formats to a file. |
| - | See here for an overview of Map, X-Section and Process/3D |
| - | Export data using ad hoc SQL queries |
And see the next tutorial to use these commands in different scenarios for using GeoData Manager.
Prints a report of one or more data sets, using ReportBuilder, a third-party application that is integrated into Geodata Manager:
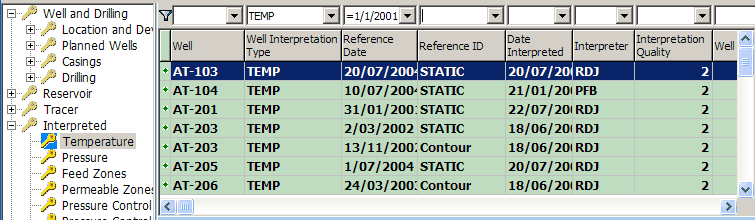
Navigate the database tree to the node with the data sets to output. Here I chose Interpreted: Temperature.
Tag the data sets to output. I used the default filter and typed >=1/1/2001 into Reference Date to select data sets for 2001 and after. Remember to press Tab after typing. Click Tag All.
Click . The report builder opens at the Design tab. The default format has the header data arranged down the page at the top of every page and the detail data in columns below this.
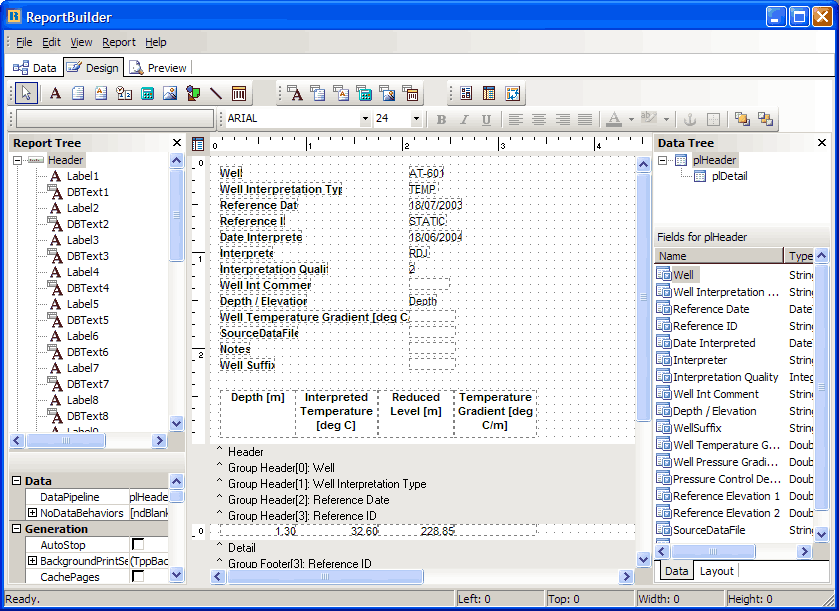
If there are many header data fields then it will waste a lot of paper. Consider deleting unimportant header fields from the report and rearranging the header data across the page.
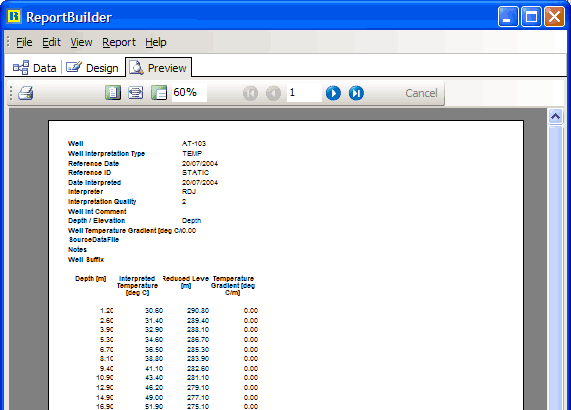
Click the Preview tab to see that.
Type Ctrl+P to print the report.
For more information on using ReportBuilder, clcik Help, then Help Topics.
The steps to output data for for Map, X-Section and Process/3D are similar:
Navigate the database tree to the node with the data sets to output.
Tag the data sets to output.
Click , or . Click one of the options from the list, for example:
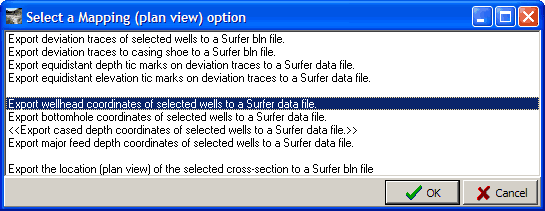
This list is different at different nodes.
Enter any more data that GeoData Manager asks for.
Select a folder and file name to save the output file to and click OK.
Here is part of a typical output: a csv file of wellhead coordinates, opened in a spreadsheet:
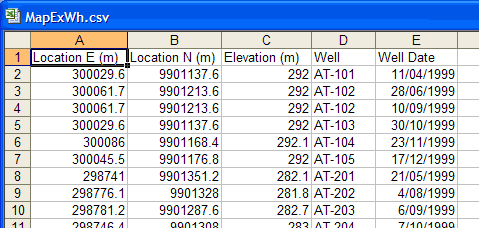
Generally, you will need to repeat the above steps several times to create several files. For example, for a typical map you might need a file of data points for a contour plus files of wellhead coordinates, wellbottom coordinates, and well traces.
The files are of a format that can be read by the 2D contouring application Surfer, but they have a standard format and can also be read by many other external contouring applications.
To find about:
Map, X-Section and Process/3D measurement units and file types, see below.
Map see here.
X-Section see here.
Process/3D see here.
All data output by Map, X-Section and Process/3D is converted to user-specified units. In most cases, the units correspond to the current unit settings in the GeoData Manager main screen. However, in some cases, particularly when the data involves a calculated field that is not present in the main screen (for example, distance along a profile), default units specified in Unit Preferences are used.
A data file typically has a x,y,z format, where x and y give the spatial locations of the data, and z gives the value of the data. For maps, x and y correspond to the UTM East and North coordinates respectively, while for profiles, x and y represent the distance from the start of the profile and the elevation.
The data file is used by Surfer to generate a grid file (interpolated values on a regular grid) and by contour plots.
A post file is used by Surfer to present the locations and names of data points on maps or profiles. Because GeoData Manager writes the location name after each data value in the data files, these files can be used as post files, simply by specifying which column in the file contains the site name.
Note that GeoData Manager often writes a number of different data values in each record of the data file, so the same file can be used to contour a range of different data. The first line of the file gives the data in each column and the measurement units.
A classed post file is used by Surfer to present the locations and names of data points on maps or profiles, using a range of sybols depending on the numeric value of a specified column. Whener GeoData Manager mentions a classed post file, a numeric column will be written to the file that can be used to determine the symbol in Surfer.
Note that GeoData Manager often writes a number of different data values in each record of the data file, so the same file can be used to contour a range of different data. The first line of the file gives the data in each column and the measurement units.
A boundary line is a special format used by Surfer to draw geo-referenced lines and polygons using the Map: Base Map... option. Each connected line segment begins a header line giving the number of vertices in the line segment, followed by an ordered list of comma-separated vertex coordinates. GeoData Manager adds useful information to the header line to better identify the data source.
Map outputs a file of a horizontal slice of data from different sites. Options are typically:
Output values (eg temperatures) at a specified depth.
Output depth to a specified value (eg the depth to a specified temperature).
Vertical distances as elevation or depth down the well:
Elevation Generally used for reports.
Depth down the well Generally used by drillers.
The typical format for each line in the output file is:
East Location, North Location, Value, Site Name, plus other optional data fields (eg well date, data identifiers)
For an tutorial on how to use Map see here.
X-Section outputs a file of data projected onto a vertical cross-section through the field.
The typical format for each line in the output file is:
Distance along cross section, Elevation, Value, Site Name, plus other optional data fields (eg well date, data identifiers)
Before you use X-Section, enter the cross section to be used into GeoData Manager see here.
Surfer normally contours maps - views from above. The files created by X-Section - views from the side - are formatted so that they can be dislayed on Surfer and similar external mapping applications.
For an tutorial on how to use X-Section see here.
To invoke the Process/3D command, tag some data sets and click in the toolbar.
This commands has options to do specialized calculations on the tagged data sets and to create files in a range of formats, including formats that can be used by external 3D contouring applications. You can use this command at these nodes:
Reservoir: Production: options to calculate flows, summed flows and cumulative flows at regular time steps.
Well & Drilling:Location and Deviation: outputs inclination and azimuth.
Reservoir: Downhole PT and Interpreted Temperature and Pressure: options to output data for 3D contouring.
Simulation: TOUGH2: Production History: production history format and export.
Chemistry: Fluids by Sample: calculation and export of activity quotients.
Data Integrity Checks: various checks of data integrity.
Process/3D is different to the Process command while editing a data set, which does specialised calculations for one data set.
Process/3D is different to the 3DViews command, which shows data on a 3D viewer built into GeoData Manager.