Introduction
Tutorials
Getting familiar with GeoData Manager
Changing how GeoData Manager looks
Scenarios for using GeoData Manager
Data types and nodes
Help with data types and nodes
Getting familiar with GeoData Manager
Changing how GeoData Manager looks
Scenarios for using GeoData Manager
Help with data types and nodes
There are 3 kinds of commands:
The menu bar is at the top of the window:

Work with the current databsae
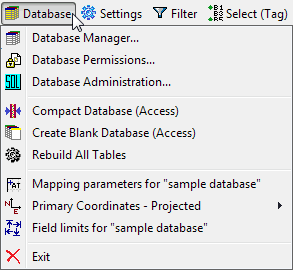
Database Manager Open the database manager window.
Database Permissions Manage database users and permissions.
Database Administration Run ad hoc SQL queries on the database from within GeoData Manager read more. Only possible if the open database is SQL server.
Compact database (Access) Compacts an Access database to remove unwanted gaps read more.
Create blank database (Access) Create a new, empty database - read about creating databases.
Activate premissions for ... database Access databases don't usually use permissions. However, you can use permissions on an Access database. First, use this command to activate permissions read about permissions.
Rebuild All Tables Rebuilds the database tables. Only do this when instructed by GSDS. For an SQL server database, you must have administrator permission.
Mapping parameters ... See here
Primary Coordinates A flyout menu to work set the primary coordinates. The options are Projected or Geographic read more.
Field Limits See here
Exit Exit GeoData Manager 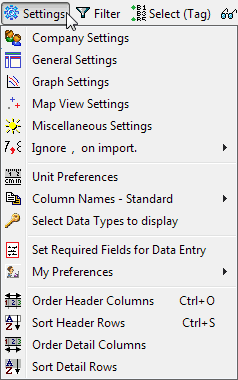
The next option determines how GeoData Manager handles thousands and decimal separators in numbers you import. If your Windows Region and language has your thousands separator as a , and your decimal separator as a . then the options are:
Ignore thousands separator , on import - usually choose this option
Raise error if thousands separator , in import
Replace decimal separator , with . on import
Column names Opens a flyout menu to choose:
Standard use GeoData Manager's default, English, name (FieldName)Custom use your preferred names (PreferredName). Select data types to display See here.
Set required fields for data entry Set mandatory fields to enter for each new dataset you create see here.
My preferences A flyout menu to work with the settings files manually see here.
Order Header Columns Change the columns in the header window
Sort Header Rows Change the order of rows in the header window
Order Detail Columns Change the columns in the detail tab
Sort Detail Rows Change the order of rows in the detail tab
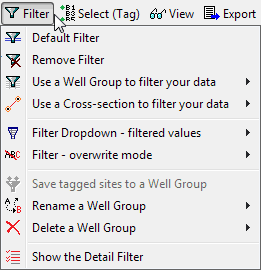
Default filter Set the filter bar to the default filter for the current node read more.
No filter Clear all items in the filter bar read more.
Filter dropdown ... and Filter ... These control the behavior of the dropdown lists in the filter bar see here.
Show/hide detail filter The detail filter lets you filter datasets by their detail data see here.
The rest of the menu options are for using site groups, see here.
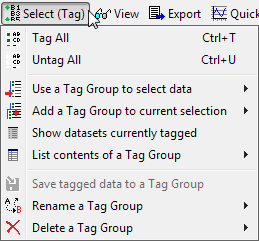
Tag all tag all datasets in the header window.
Untag all untag all datasets in the header window.
The rest of the menu options are for using tag groups, see here.
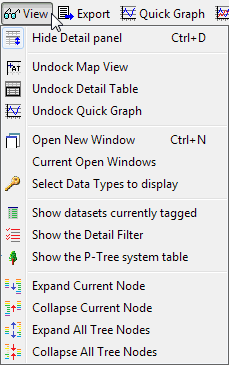
Hide/show Detail Panel Hide or show the Details tabs.
Undock/dock Map View, Undock/dock Detail Table, Undock/dock Quick Graph See here
Open new window, Current open windows see here.
Select data types to display See here.
Show datasets currently tagged
Show/hide the detail filter The detail filter lets you filter datasets by their detail data see here.
Show/hide the P-tree system table see here
Expand Current Node, Collapse Current Node, Expand All Tree Nodes, Collapse All Tree Nodes Change what is displayed in the database tree.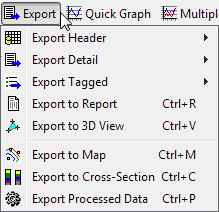
Export Header Export header data from the tagged datasets.
Export Detail Export detail data from the currently selected dataset in the header window.
Export Tagged Export header and detail data from the tagged datasets.
Export to Report Print a report from the tagged datasets.
Export to 3D view Export to a 3D view from the tagged datasets.
Export to Map Output a horizontal slice from the tagged datasets.
Export to Cross-section Output a slice of data on a vertical cross-section from the tagged datasets.
Export Processed Data Output data from the tagged datasets in a range of specialized formats.
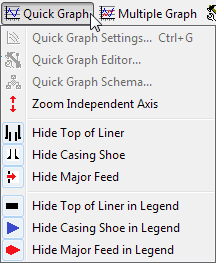
Quick Graph Settings Define graph axes and the fields to graph.
Quick Graph Editor Change the details of presentation.
Quick Graph Schema Change line types, colours, symbols.
Zoom ... Zoom all directions (all axes) or zoom independent axis only read more.
Hide/Show Top of Liner Hide or show a symbol for the top of the liner on the graph, at the depth of the top of liner.
Hide/Show Casing Shoe Hide or show a symbol for the casing shoe on the graph, at the depth of the shoe.
Hide/Show Major Feed Hide or show a symbol for the feed on the graph, at the depth of the feed.
Hide/Show Top of Liner in Legend If Hide/Show Top of Liner above is set to show, this will hide or show a symbol for the top of the liner in the graph's legend.
Hide/Show Casing Shoe in Legend If Hide/Show Casing Shoe above is set to Show, then this will hide or show the symbol for the casing shoe in the graph's legend.
Hide/Show Major Feed in Legend If Hide/Show Major Feed above is set to Show, then this will hide or show the symbol for the feed in the graph's legend.
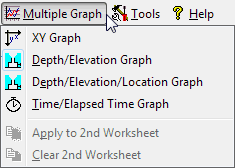
XY Graph, Depth/Elevation Graph, etc. GeoData Manager displays in this menu a list of graph types appropriate for the data sets selected. Click one of these to go to Multiple Graph and display a graph of that type. Note: if you click Multiple Graph in the toolbar, GeoData Manager displays the normally the default graph, which is usually the one you want to see.
Apply to 2nd Worksheet Indicate data sets for multiple graphing.
Clear 2nd Worksheet Undo the above command.
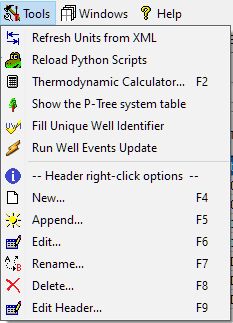
Refresh Units from XML See here.
Reload Python Scripts See here.
Thermodynamic Calculator Start the Thermodynamic Calculator.
Show/hide the P-tree system table see here
Fill unique well identifier see here
Run well events update see here
New, Append, Edit, Rename, Delete, Edit header These duplicate items in the menu when you right-click a line in the header table.You can run several copies of GeoData Manager at the same time, each in a separate window.
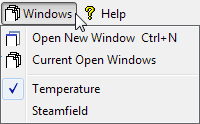
Open new window Open a new copy of GeoData Manager in a new window.
Current open windows Displays a list of the current open GeoData Manager windows. Click a window in the list to select it, then click:
Switch to window to switch to a the selected window. You can also switch to a different window by clicking a window name in this Windows menu.Close window to close the selected window. You can also close a window by clicking the X at the top, right of the window.The rest of this menu is a list of open GeoData Manager windows. Temperature and Steamfield in the menu above. Click a name in the list to switch to that window.
Note
The main reason for opening GeoData Manager in other windows is is to work with and perhaps compare different data sets at the same time. The copies are partially synchronised, like this:
You can navigate do a different node in each window, and display different data sets.
If you add, delete or change a data in one window, for example a data set or your preferences, then other windows will change accordingly. The change is not immediate, but after the the other windows are refreshed, for example by clicking on a different node, then clicking on the original node again.
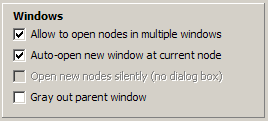
Windows options
There are options in the Miscellaneous settings to control GeoData Manager windows:
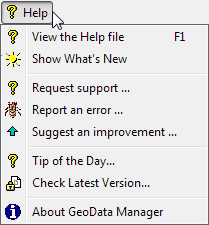
Help Open this help guide.
Show what's new Open this help guide at What's new.
Request Support, Report an Error, Suggest an Improvement Send an email to GSDS.
Tip of the Day
Check Latest Version Starts your internet browser and connects to the gsds website to display the latest version of GeoData Manager. You can find the version of your copy of GeoData Manager in Help > About GeoData Manager.
About GeoData Manager Has four tabs:
About displays GeoData Manager's version, a copyright and links to the GSDS website.
Registration to enter your key to register GeoData Manager.
Credits Do not double-click in this window.
Change log A list of recent changes to GeoData Manager.
Commands from the main toolbar:

| Button | Action |
|---|---|
Details |
Show or hide the Details tab in the home window. |
Tag all |
Tag all the data sets in the header window. |
Untag All |
Untag all the data sets in the header window. |
Sort |
Change the order of rows in the header window. |
Order |
Change the columns in the header window. |
| Before using the buttons below, tag some data sets in the header window | |
Export Header |
Export header data from the tagged datasets: Either click the  to the right of the button and select an export file type, to the right of the button and select an export file type,Or click the button to use the same file type that you used last time; to see this type, hover the mouse over the button. |
Export Tagged |
Export header and detail data from the tagged datasets: Either click the to the right of the button and select an export file type,Or click the button to use the same file type that you used last time; to see this type, hover the mouse over the button. |
Report |
Print a report from the tagged datasets. |
Multiple Graph |
Open a multiple graph from the tagged datasets: Either click the to the right of the button and select the kind of graph to display,Or click the button to display the same kind of graph that you used last time; to see this kind, hover the mouse over the button. |
Map |
Output a horizontal slice from the tagged datasets. |
Cross-Section |
Output a slice of data on a vertical cross-section from the tagged datasets. |
Process/3D |
Output data from the tagged datasets in a range of specialized formats. |
A tab can be docked or undocked:
Shows a map of the sites of the data sets in the header window above.

Each site has a symbol:
| Symbol | Indicates sites with |
|---|---|
| Blue cross | data |
| Grey dot | no data |
| Red cross | data and selected by the filter bar |
| Red dot | no data and selected by the filter bar |
| Green cross | tagged data and the data set is in the header window |
| Green dot | tagged data and the data set is not in the header window |
| Orange circle | sites on a cross section |
| To do this | do this |
|---|---|
| Zoom in | Left-click or Left-hold and drag to right |
| Zoom out | Right-click |
| Pan (move map) | Right-hold and drag |
| Reset map or graph to default size | Left-hold and drag to left |
| Action | does this |
|---|---|
| Click a site | Select the site; the cross turns red |
| Right-click a site | Deselect the site; the cross turns back |
You can also:
Select sites by selecting them from the filter bar dropdown menu.
Deselect sites by deleting site from the list in the filter bar field.
Enter a cross section by clicking on the map read more.
Shows or hides selected cross sections. To select which cross sections, click the beside the button and select from the menu. In this menu, labels are cross section names.
Shows or hides traces for selected wells. To select which wells, click the beside the button and select from the menu.
A site is a symbol (see above), the name of the site (eg a well name) plus well traces (if the site is a well). This button toggles visibility of sites between all sites and a selected sub-set. To select a sub-set, click the beside the button and select from the menu.
A site label is the name of the site (eg a well name). This button toggles visibility of site labels between all sites and a selected sub-set. To select a sub-set, click the beside the button and select from the menu.
Toggles between East/North and Longitude/Latitude read more.
Shows the detail data of the data set selected in the header window.

Export Detail Export the data set in the header window that you have just clicked:
Either click the to the right of the button and select an export file type,
Or click the button to use the same file type that you used last time - to see this type, hover the mouse over the button. Read about export.
Shows a graph of the data set selected in the header window. There are no toolbar commands here. To change the look of a quick graph use the Quick Graph menu.