Introduction
Tutorials
Getting familiar with GeoData Manager
Changing how GeoData Manager looks
Scenarios for using GeoData Manager
Data types and nodes
Help with data types and nodes
Getting familiar with GeoData Manager
Changing how GeoData Manager looks
Scenarios for using GeoData Manager
Help with data types and nodes
This tutorial creates a production history for the simulation modeller; a history of flows between the start of 2000 and the end of 2007 and averaged by the month.
Navigate to Simulation - TOUGH2: Production History.
Right-click in the header window and click New.
Enter identifiers:
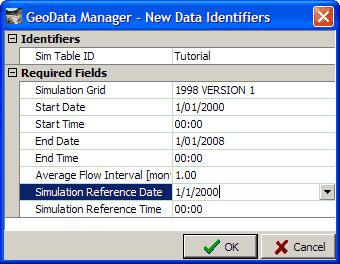
Start and End Date: The start and end dates of the history.
Average flow interval: The length of time to average the flows over. To change the unit to Month, right-click the value and click Month.
Simulation Reference date: I entered the start date.
Click OK.
Select the records to use for the history:
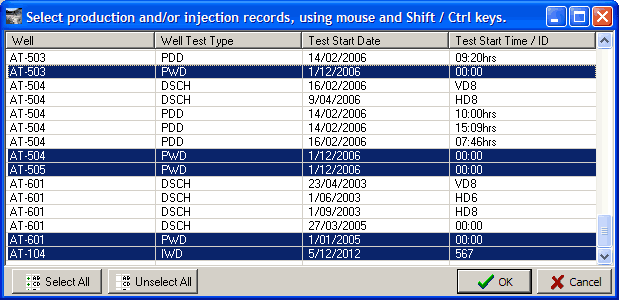
I Ctrl+clicked the PWD and IWD records (to get production and injection flow measurements).
Click OK. You see the records you clicked, there are seventeen:
Now use Process to calculate feedzone data (all this will be explained below): Click Process:
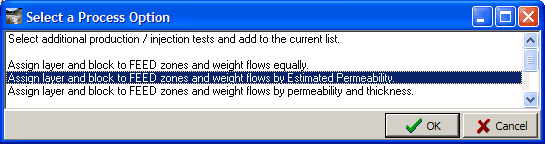
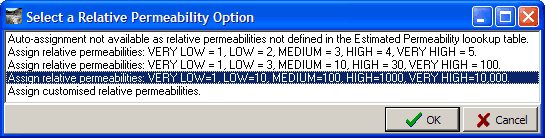
Click the option highlit above and click OK:
Click the option highlit above and click OK. Process calculates the feedzone data, outputting some Information messages at the bottom of the window.
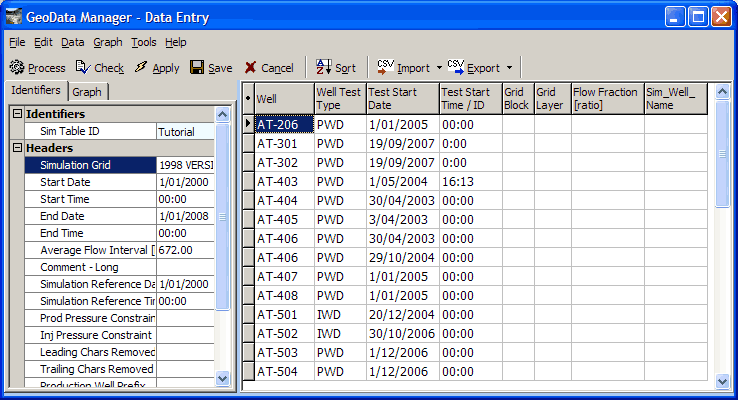
In the column Sim_Well_Name type the well names that the modeller uses; here it is your well name without the dash:
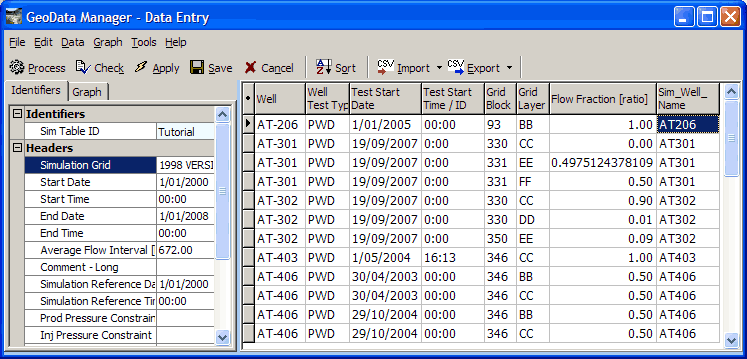
And that is the result. Process looks up the well's interpreted feed zone depth(s), looks at Location and Deviation to find where in the ground the feedzones are and looks at the grid to find what grid layer and cell each feedzone is in. There are now more than seventeen rows in the detail table because some wells have more than one feedzone (AT-301 has three).
From each interpreted feedzone's Estimated Permeability (VERY LOW, LOW, MEDIUM etc), Process calculates a relative permeability from the option you chose above and then calculates the Flow Fraction (the relative contribution of each feed zone).
Tip:
Use Ctrl+D to duplicate a Sim_Well_Name from the row above.
Use Tools: Accurate Cell Edit to see Flow Fractions that are close to zero.
Usually the best options for Select a Relative Permeability Option above are the fourth (VERY LOW=1, LOW=10, MEDIUM=100 etc) or the third (VERY LOW=1, LOW=3, MEDIUM=10 etc) because otherwise the Flow Fraction will be too much weighted to feedzones with lower permeabilities.
Click Save
In the TOUGH2: Production History header window, tag the data set you just entered and click Process:
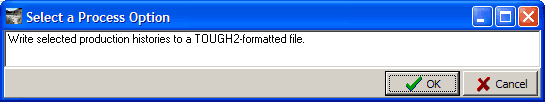
Click the option and click OK.
Process creates the final production history file from the production history data set and from the steam, brine and total mass flows from the discharge measurements over time for the wells.
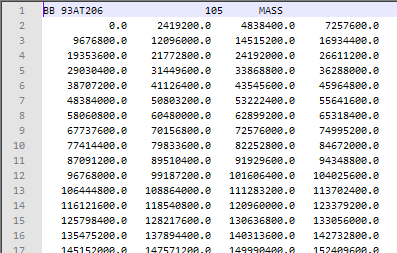
Here is the start of the file, displayed in a text editor: