Introduction
Tutorials
Getting familiar with GeoData Manager
Changing how GeoData Manager looks
Scenarios for using GeoData Manager
Data types and nodes
Help with data types and nodes
Getting familiar with GeoData Manager
Changing how GeoData Manager looks
Scenarios for using GeoData Manager
Help with data types and nodes
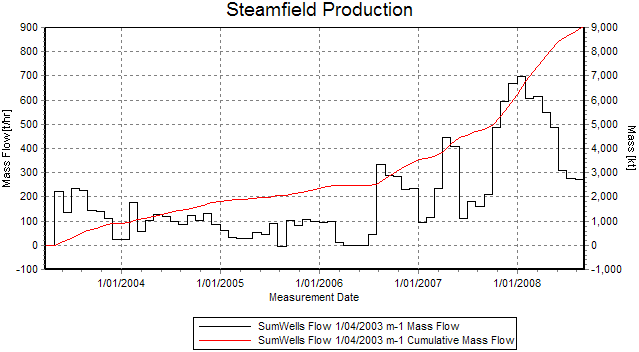
Data sets at Steamfield: Production have steam, brine and total flow rates, but not cumulative totals. This tutorial shows how to use a Process/3D option to calculate cumulative totals, then use Multiple Graph to display them.
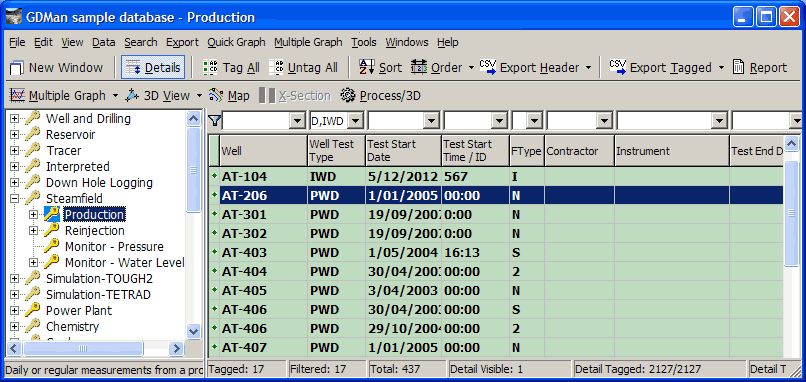
In the sample database, go to the node Steamfield: Production.
In the filter bar, click  and click
 Default Filter in case the filter was different.
Select production data sets of type PWD and IWD: In the filter bar, Well Test Type is already PWD. Click the  to the right of Well Test Type and click
 IWD in the list to add IWD wells.
Click Tag All:
Click Process/3D:
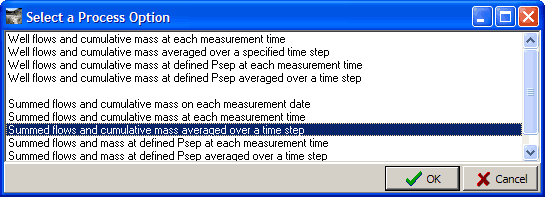
Click Summed flows and cumulative mass averaged over a time step and click OK. We will later choose one month as the time step, to get monthly production. Now answer some questions ...
Dates ?
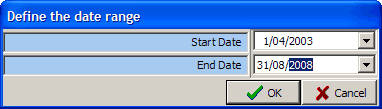
Enter the start and end dates for the report.
Type of report ?
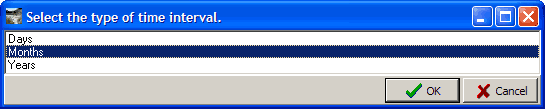
For this, double-click Months.
Time interval ?
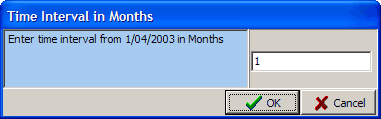
For this, the default (1) is right (the time step is one month). Click OK.
The result is a csv file: select a folder and file name and click OK. Here is a part of the file, opened in a spreadsheet:
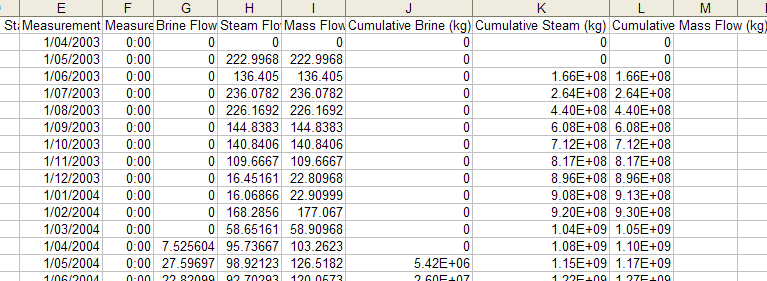
As expected, it has a row for each month, and each row has flow rates and cumulative masses, summed for all wells.
You now want to view the data in the file. One option would be to use an external program, like a spreadsheet, to print a report. A better option is to use Geodata Manager's Multiple Graph to display a graph, then output the graph. To use Multiple Graph:
The data we are graphing is not in data sets but in a file, so we will need to import the file.
Multiple Graph does a great job of setting the defaults for the worksheet and the graph, but we will need to add the three cumulative fields (brine, steam, total) to the worksheet.
Stay at the node Steamfield: Production. Click Untag All.
Click Multiple Graph. GeoData Manager reminds you there are no data sets tagged. Click OK.
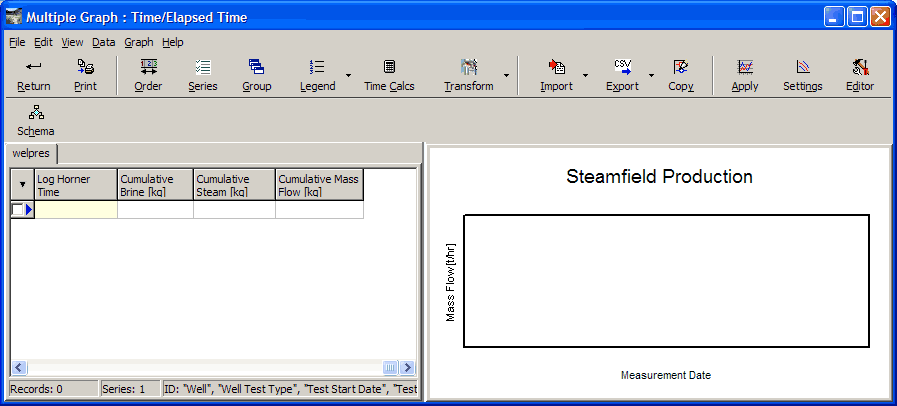
Multiple Graph shows an empty worksheet:
![]()
The point of the above three steps is to open Multiple Graph with that empty worksheet that almost has the right fields for importing the csv file into, lacking only those three cumulative fields (brine, steam, total).
Now add those three fields to the worksheet using transform: Click the beside Transform and click Add field to Worksheet.
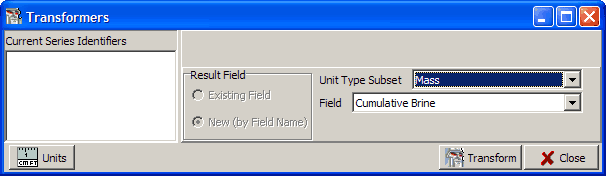
Select a Unit type subset of Mass (because the cumulative fields have units of mass) and select a Field of Cumulative brine. Click Transform. Transform adds the field cumulative brine to the worksheet, but otherwise nothing much happens.
Repeat the above for the other fields Cumulative steam and Cumulative mass flow. Click Close.
If you scroll to the end of the worksheet, you will see those three cumulative fields you added:
Now import the monthly report file: Click the beside Import and click Comma Separated Value File.
Choose the csv file you created above:
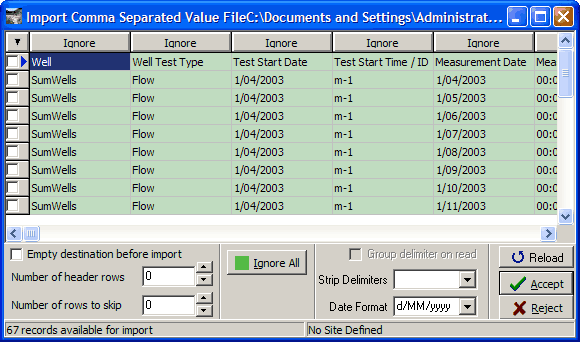
Click each column heading Ignore in turn and select the correct value, which is in the line below.
Turn on Empty destination before import and set Number of header rows to 1 (the first row in the file has the correct values for the column headings, not production data, so we want to skip this row):
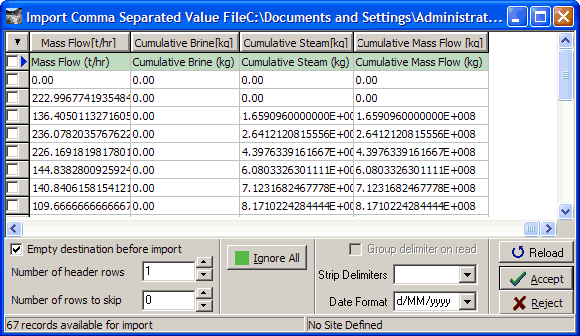
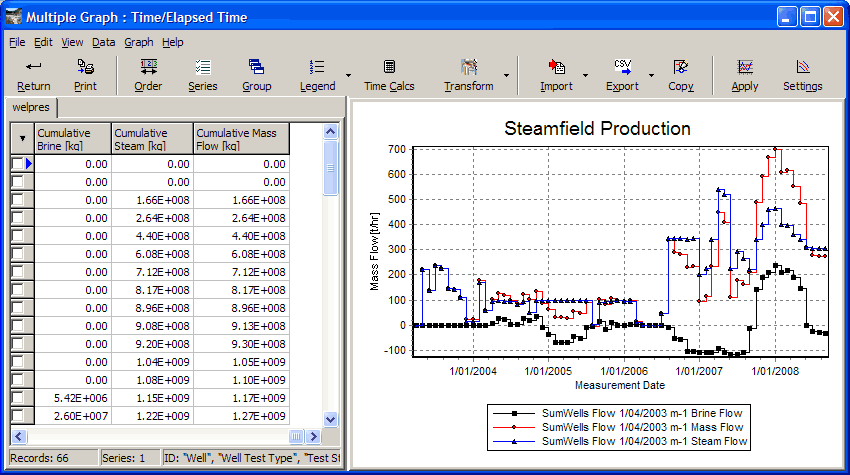
Click Accept to import the file. The file is imported to the worksheet, including the three cumulative fields. The default graph has mass flows but not yet cumulative flows:
In Settings, set:
Show points: (top of window) = Off.
Dependent Axis 1: Autoscale Axis = Off; Minimum = -100; Maximum = 900.
Dependent Axis 2: = Mass (for the cumulative fields); Autoscale Axis = Off; Minimum = -1000; Maximum = 9000; Stairs = Off.
Visible fields 1: All six boxes ticked.
Right-click the right axis and change the units from kg to kT. The graph is complete:
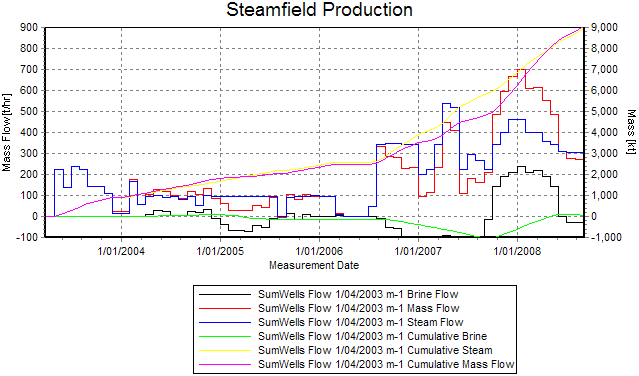
You can use Schema to change the series colours.
Now just display total mass flow and cumulative mass flow: In Settings: Visible fields 1 untick the four brine and steam boxes: