Introduction
Tutorials
Getting familiar with GeoData Manager
Changing how GeoData Manager looks
Scenarios for using GeoData Manager
Data types and nodes
Help with data types and nodes
Getting familiar with GeoData Manager
Changing how GeoData Manager looks
Scenarios for using GeoData Manager
Help with data types and nodes
This tutorial creates a map in Surfer of the stratigraphy along the cross section P1 in the sample database:
We will create four files for Surfer:
A file of the well stratigraphy along cross section P1.
A file of wellhead elevations, to allow us to display ground level on the cross section.
A file of well traces, to allow us to display these on the cross section.
A file of well bottomhole coordinates. We want to label each well with the well's name, and if we label the wellheads then the labels at each drilling pad will usually overlap. So, we use this file so we can label the bottom of each well instead, which do not tend to overlap.
First, we will select the wells to appear on the cross section. There are two ways to do this:
Tag all wells and start. GeoData Manager will ask for a profile to use and will select wells on this profile.
Tag the wells on the profile and then start.
The second is preferable because you can check that enough wells have stratigraphy to make it worth while creating the cross section. We will do the second:
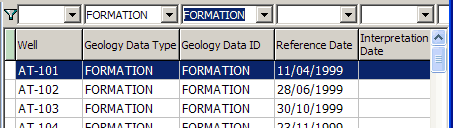
In the sample database, go to the node Geology: Well Stratigraphy.
In the filter bar, click  and click
 Default Filter in case the filter was different.
Select stratigraphy data sets of type FORMATION: In the filter bar, click the  to the right of Geology Data ID and click FORMATION in the list:
Click the at the left of the filter bar:
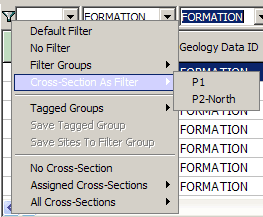
Click Cross-Section as Filter and click P1 in the list. This filters the wells in the header window to only show those belonging to the cross section.
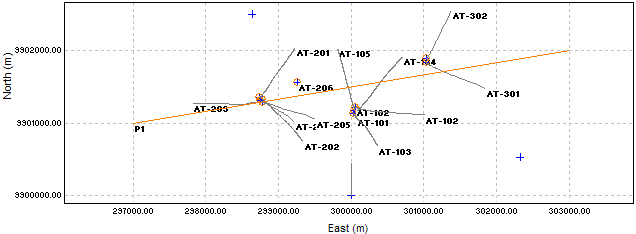
Now, display cross section P1 and its wells on the map (this is optional, and just for interest):
Click the Map View tab to display the well map.
Click the to the right of X-Sections in the tab toolbar:
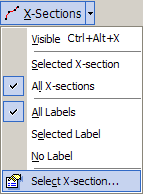
Click Select X-Section in the menu and choose P1 from the list.
Use the visibility buttons in the map tab toolbar to show the profile and its wells:
And, finally:
Tag All to select the wells on the cross section P1. Scroll through the wells and untag any you don't want. Click Map:
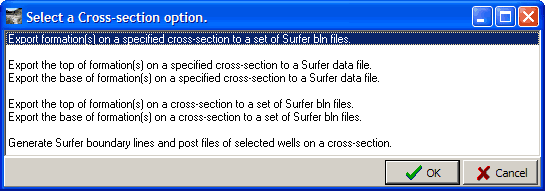
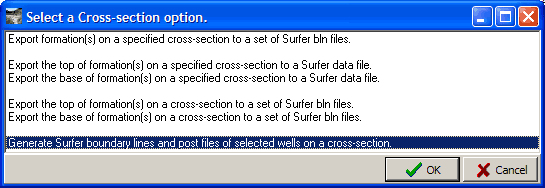
Click Export formation(s) on a specified cross section ... and click OK. Now answer some questions ...
Formations to use ?:
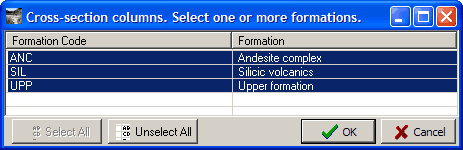
This lists the formations found down the wells. Usually click Select All, or else select the ones you want.
Cross section to use ?:
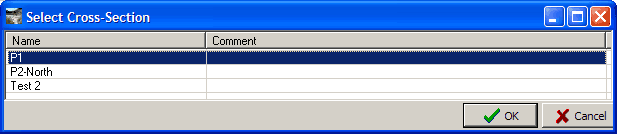
Double-click the cross section to use, P1. If you started by tagging all wells, then this will select only the wells belonging to the cross section. As explained above, we have already tagged the wells belonging to the cross section. But you still need to double-click P1.
Column width ?:
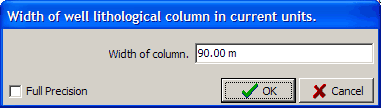
Now just click OK to use the default value. You will change this later if it is not good.
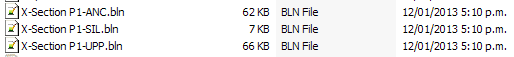
The result is one bln file for each formation found down the wells: select a folder and file name and click OK. Enter X-Section P1 for a file name and get three files:
Use the wells already tagged. Click Map in the toolbar:
Double-click Generate Surfer boundary lines and post files ....
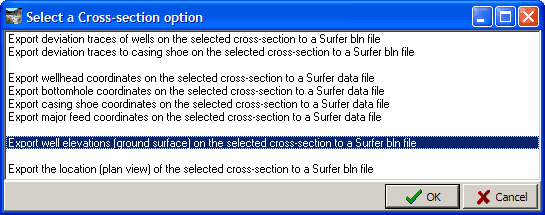
Double-click Export well elevations ....
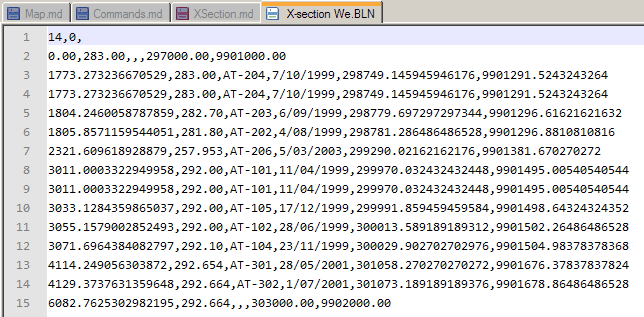
The result is a bln file: select a folder and file name and click OK. Here is the file, opened in a spreadsheet:
Export deviation traces .... Export bottomhole coordinates ....Start Surfer. This assumes you know how to use Surfer.
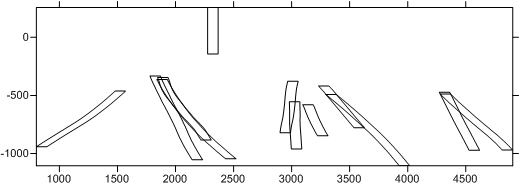
You have one bln file for each formation found down the wells. Import the first of these, X-Section P1-ANC.bln as a base layer:
Check the column width: When you created the file of well stratigraphy along P1 you selected a column width to use. This is the width of the columns you see in the map above. The default value is good here, but if you want to change it then repeat the steps to create the file of well stratigraphy along P1 and choose a different column width.
Assign that base layer to be purple and 50 % opacity.
Import the rest of the bln files of formations as base layers:
Import X-Section P1-SIL.bln and assign it pink and 50 % opacity.
Import X-Section P1-UPP.bln and assign it yellow and 50 % opacity.
Import the file of wellhead elevations as a base layer. Colour it green and a nice width.
Import the file of well traces as a base layer. Colour it black and fairly thin.
Import the file of bottomhole coordinates as a post layer. Label each well bottom with the well name, just below the bottom of the well.
Increase the extent of the map in each direction to give some space around the cross section:
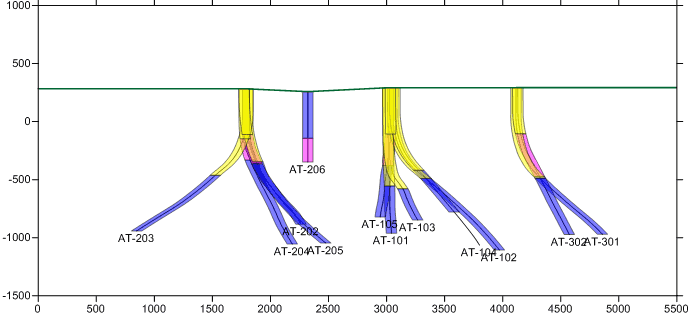
Finally, check the map looks reasonable:
The data for well AT-206 looks wrong, because the formation near the top (purple) is near the bottom of the other wells.
For well AT-104, the formations don't extend to the bottom of the well.