Introduction
Tutorials
Getting familiar with GeoData Manager
Changing how GeoData Manager looks
Scenarios for using GeoData Manager
Data types and nodes
Help with data types and nodes
Getting familiar with GeoData Manager
Changing how GeoData Manager looks
Scenarios for using GeoData Manager
Help with data types and nodes
This tutorial creates maps by grid layer of permeable regions, from rock types in the simulation model. Use the map to compare actual and modelled permeable regions.
Navigate to Simulation - TOUGH2: Simulation Models: Rock Types.
In the header window, click the grid to use. In the detail tab:
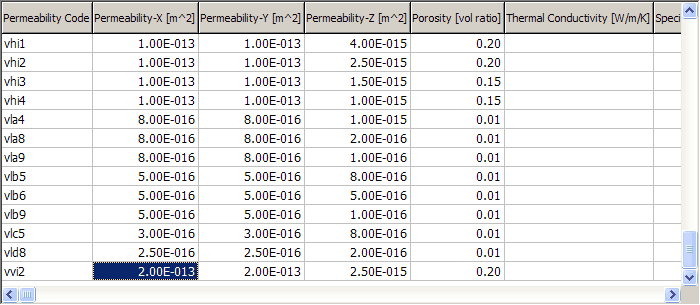
Note Permeability Codes (equivalent to rock types) with high permeability: here vhi1, vhi2, vhi3, vhi4 and vvi2.
Navigate to the node below, Assigned Rock Types, which shows what rock type is assigned to each block in each layer.
In the header window, tag the grid to use.
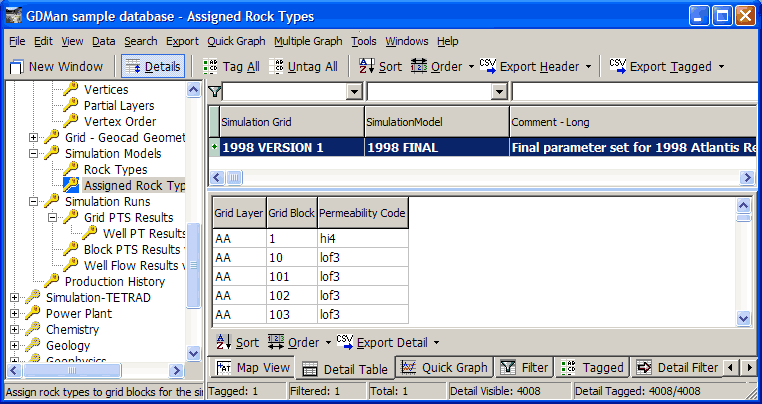
Decide what layer you want to map Permeability Codes (rock types) on. Either look in the detail table for a layer that has Permeability Codes you are interested in, or look at other data (Note: to find the layer at a certain elevation, navigate to Simulation - TOUGH2: Grid - Mulgraph Geometry: Layers and look it up). I chose FF, the top layer with the high-permeability codes.
Click Map:
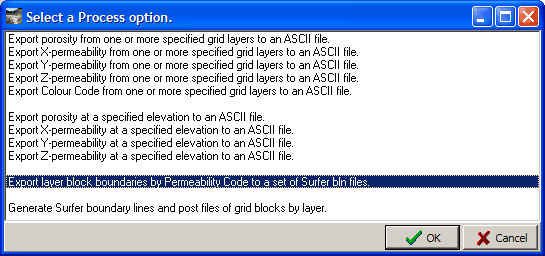
Double-click the option hilit above.
Layer ?
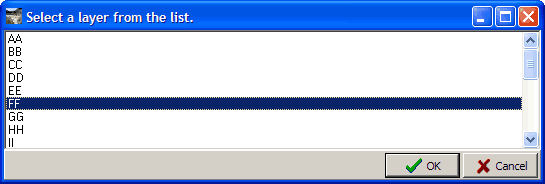
Double-click the layer you decided on above.
Permeability Codes ?
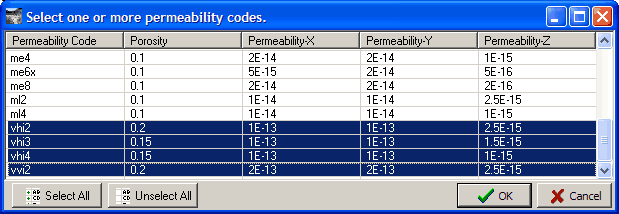
Ctrl+click the Permeability Codes you noted above. Click OK.
Enter a file name and click Save. GeoData Manager creates a separate file for each Permeability Code.
Open the files as a maps in Surfer. Each square is a block on the layer with that Permeability Code. Colour it.
Compare these maps with other maps of permeable regions: