Introduction
Tutorials
Getting familiar with GeoData Manager
Changing how GeoData Manager looks
Scenarios for using GeoData Manager
Data types and nodes
Help with data types and nodes
Getting familiar with GeoData Manager
Changing how GeoData Manager looks
Scenarios for using GeoData Manager
Help with data types and nodes
This tutorial creates maps by grid layer of permeable regions, from feedzones. Use the map to compare actual and modelled permeable regions.
Select feedzone data: Navigate to Interpreted: Feed Zones. In the filter bar, set Well Interpretation Type to FEED to filter the feedzones by well. Click Tag All:
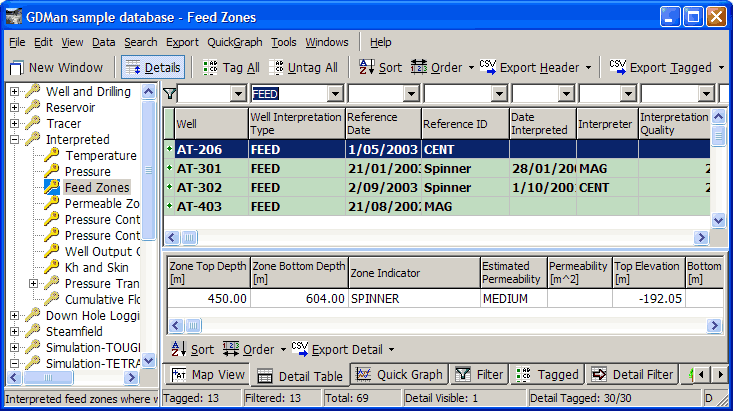
Click Map:
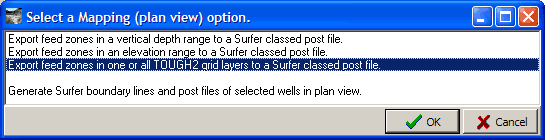
Double-click the option highlit above.
Grid ?
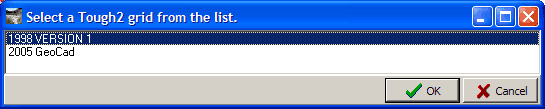
Double-click the simulation grid to use.
Layers ?
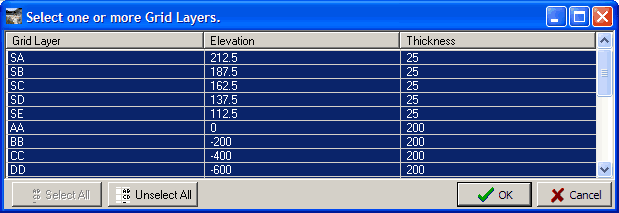
Select the grid layers to find feedzones in: here click Select All. Click OK.
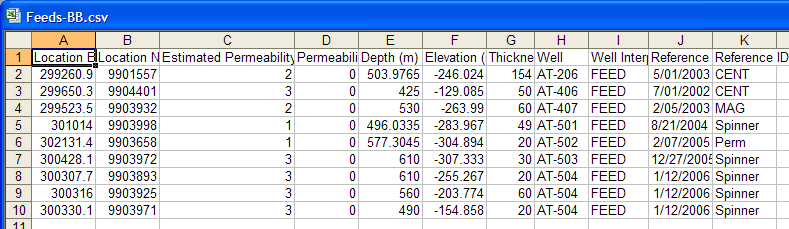
Enter a file name and click Save. GeoData Manager creates a separate file for each layer with feedzones, and ignores layers without feedzones. The highest layer with feedzones is BB, here opened in a spreadsheet. There are nine feedzones in BB; most wells have one but well AT-504 has three.
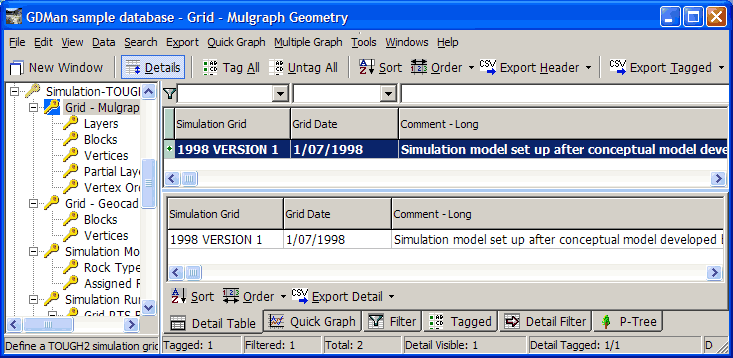
Navigate to Simulation - TOUGH2: Grid - Mulgraph and tag the simulation grid to use (the one you selected above).
Click Map:
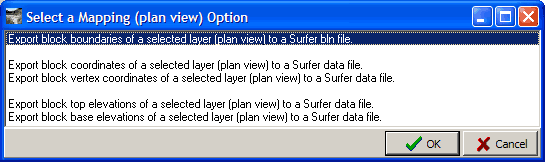
Double-click the option highlit above.
Layer ?
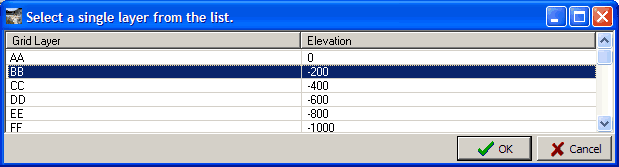
Click any full layer to get a map of all block boundaries or click a partial layer to get a map of just the blocks in that layer. Here we want all blocks, so click say BB and click OK.
Enter a file name and click Save.
Open Surfer.
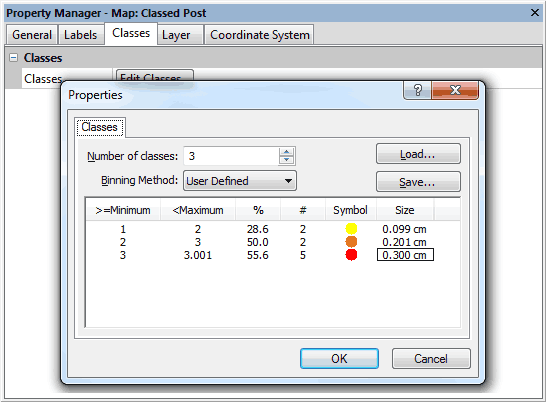
Set up the first feedzone layer map: Click Map: Add: Classed Post Layer and import the layer file.
It is a classed post layer because each feedzone has an Estimated Permeability, 1, 2 or 3, and we can mark each feedzone accordingly: Open the Properties window for that layer and in the Classes tab set up three dots to mark each feedzone according to its Estimated Permeability thus:
Repeat the step above to set up the other feedzone layer maps in turn.
Add the file of block boundaries as a base map.
If it is not present already, add well data to the map: wellhead and bottom hole coordinates, well traces as described here.
Here is the map of feedzones for layer BB:
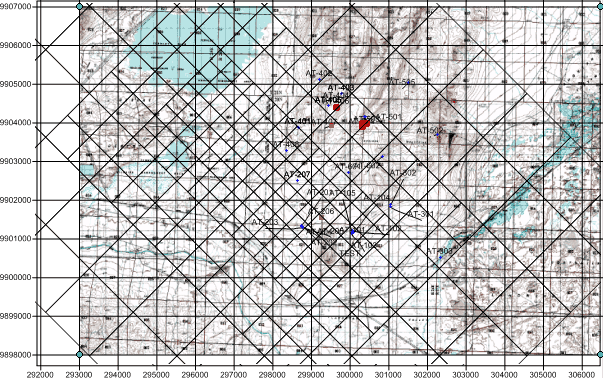
The feedzones are in a cluster and could run in a line north-west to south-east. Turn on the maps of feedzones in other layers to see what happens at different depths.
Tip: Label each block with the block name (Grid Block).
Compare these maps with other maps of permeable regions:
See here to map permeable regions from geology.
See here to map permeable regions from the simulation model rock types.